
Which is the hardest endurance sport and where does cycling rank against the likes of running, swimming and cross-country skiing? This is a question that two-time Olympic champion and multiple-time world champion triathlete Alistair Brownlee has been wrestling with in a new article, and he has some answers… Kind of.
Alistair Brownlee retired from triathlon in 2024, and one of the ways he keeps himself out of trouble these days – alongside winning brutal ultra-distance bikepacking events for fun – is as head of research at Terra.
Terra describes itself as: “an API [application programming interface] that makes it easy for apps to connect to wearables”. Essentially, Terra connects apps to health and fitness data from Garmin, Wahoo, Suunto, Apple Health and loads more devices. The long and the short of it is that Alistair Brownlee is able to get his hands on a whole lot of data.
Before we start, it’s worth acknowledging that he is fully aware that ‘hard’ means different things to different people, so how are we going to quantify it? Psychologically demanding; technically difficult to master; high risk – they’re all hard, so Brownlee and his colleague Halvard Ramstad have defined what they’re talking about here. They want to know which sport pushes the cardiovascular system the hardest during a typical session and they’ve looked at a “dataset comprising thousands of European athletes across nine activity types”, although we’re not told the sources more specifically than that.
Okay, let’s cut to the chase. What did they find out?
First of all, if you look at average heart rate (HR) per session, running comes out at the top with a median or 145. Hot on its heels in second place is indoor cycling (134) followed by cross-country skiing (131), outdoor cycling (125), and open-water swimming (119).
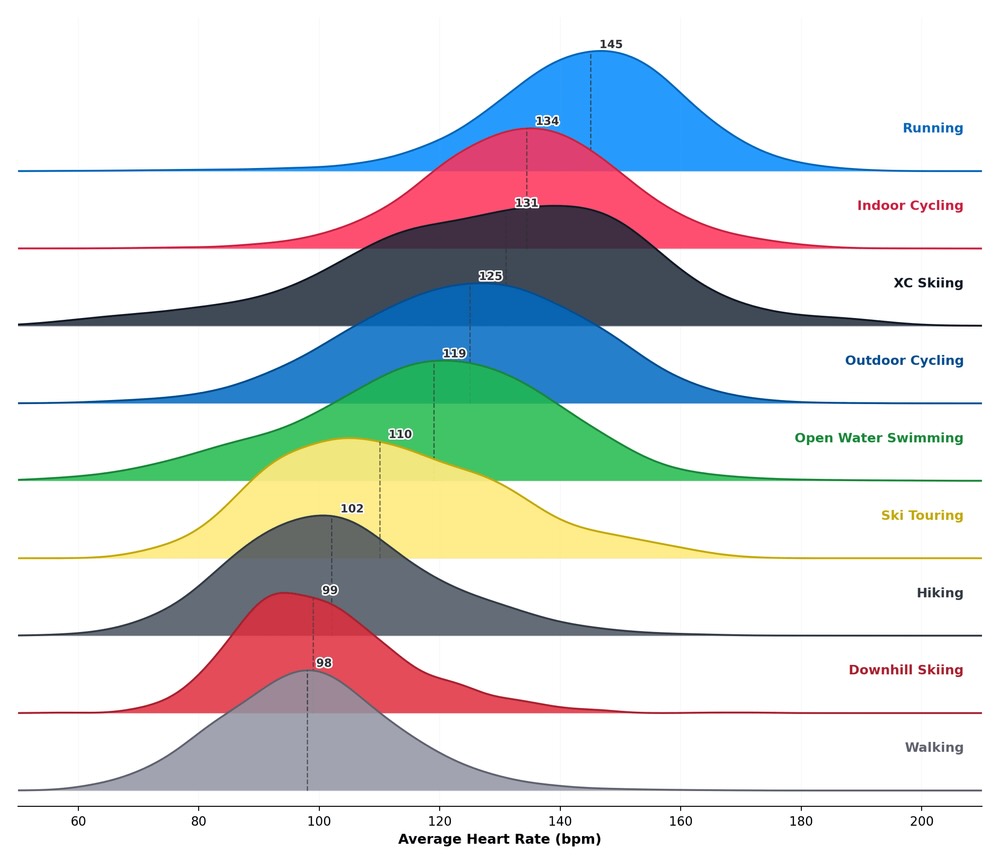
The discrepancy between indoor and outdoor cycling is interesting – 9 bpm (beats per minute).
Brownlee explains this by saying, “The turbo trainer eliminates coasting, traffic lights, descents, and for many people, the joy of riding for fun — the things that suppress average HR outdoors.”
Also, isn’t it partly down to the fact that when you jump on the turbo you’ve prepared yourself for a training session, whereas sometimes you just go out for ride, albeit wearing a heart rate monitor? That’s just a bit of road.cc conjecture thrown in, but we digress…
The point is, according to this data, running induces the highest median heart rate.
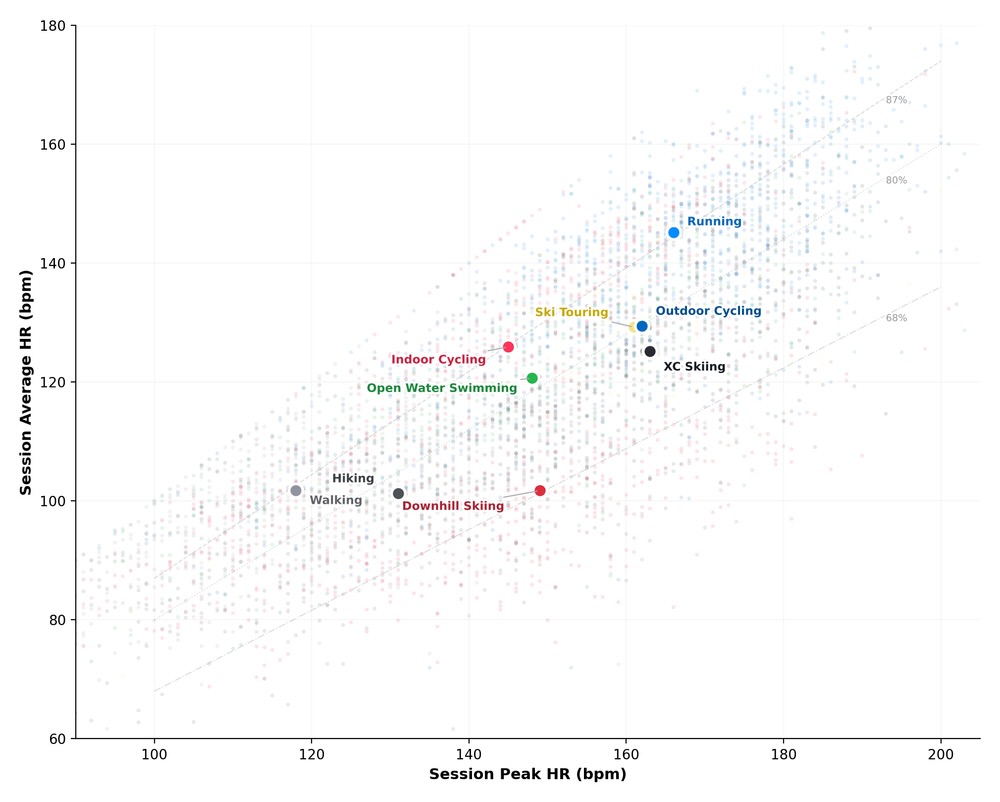
Brownlee then compares the average HR per session with the peak HR per session, and running again came out on top.
“There is no ambiguity,” he says. “Runners hold a high heart rate throughout and push to the highest peaks.”
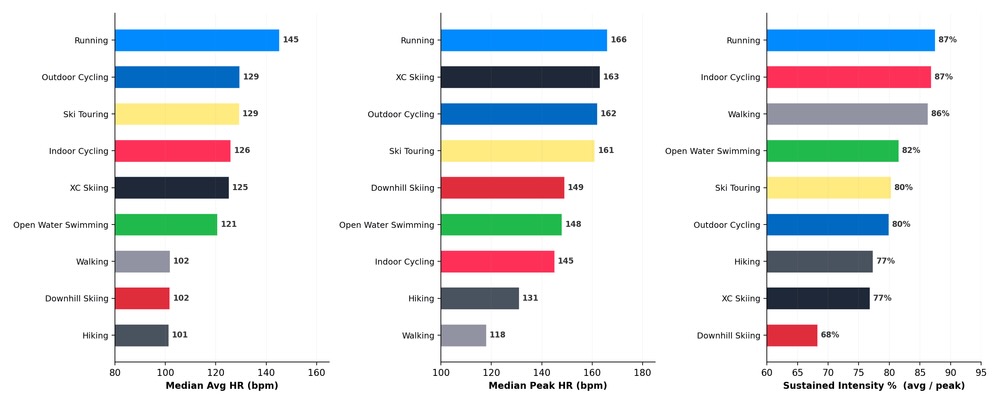
Dividing the average HR per session by the peak HR per session, indoor cycling jumped up to second place in the rankings, just behind running, while outdoor cycling dropped to mid table.
Brownlee says, “Indoor cycling’s sustained intensity ratio (86.8%) sits just 0.7 percentage points behind running. That makes sense: both are continuous, self-paced activities with no coasting and no external interruptions. What separates them is the absolute level, indoor cycling’s median average HR (134 bpm) is 11 bpm lower than running’s. The cardiovascular demand of weight-bearing locomotion at a running pace simply exceeds that of seated cycling at a typical indoor effort, even when the relative intensity profiles are nearly identical.”
Maybe runners just have a higher average HR because they’re fitter (or younger), though, rather than running being intrinsically harder? To provide a more direct comparison between sports, Brownlee took data from users who logged at least five sessions in two or more different ones. What did he find out?
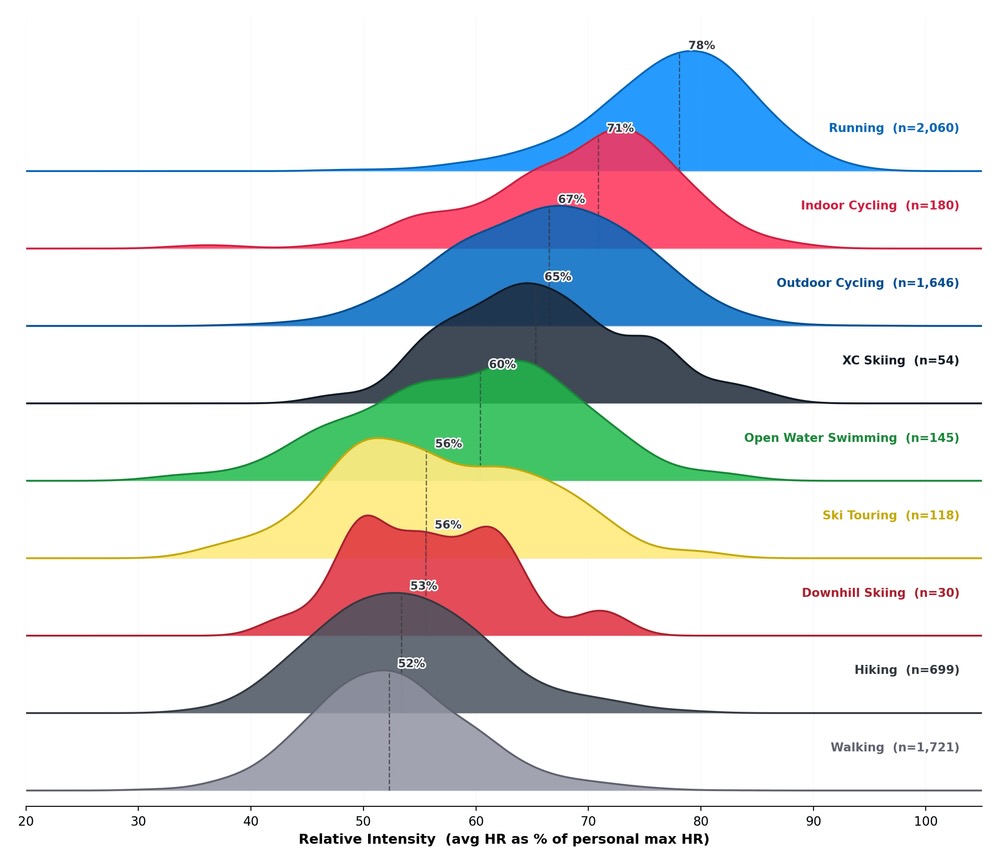
“The result is unambiguous,” he says. “The same individuals who run at a median 78% of their personal max HR cycle outdoors at just 63%, and walk at 51%. Among the 1,480 users who both run and cycle outdoors, 93% have a higher relative intensity when running, a median gap of 10 percentage points.
“It’s not that runners are fitter than cyclists, it’s that running, as a biomechanics act, demands more of the cardiovascular system than cycling does, even in the same body.”
Yeah, but what about the time factor?
Okay, that’s all about intensity; but doesn’t time come into it? Don’t bike rides tend to be longer than runs?
That’s true. The median run time in this dataset was 41 minutes, the average outdoor cycle was 64 minutes – so what do you do about that?
“We multiplied each session’s relative intensity by its duration to create ‘intensity-minutes’ — a single metric that captures total cardiovascular load. A 40-minute run at 78% of max yields 31 intensity minutes. A 64-minute cycle at 67% produces 42.”
Okay, where does that get you?
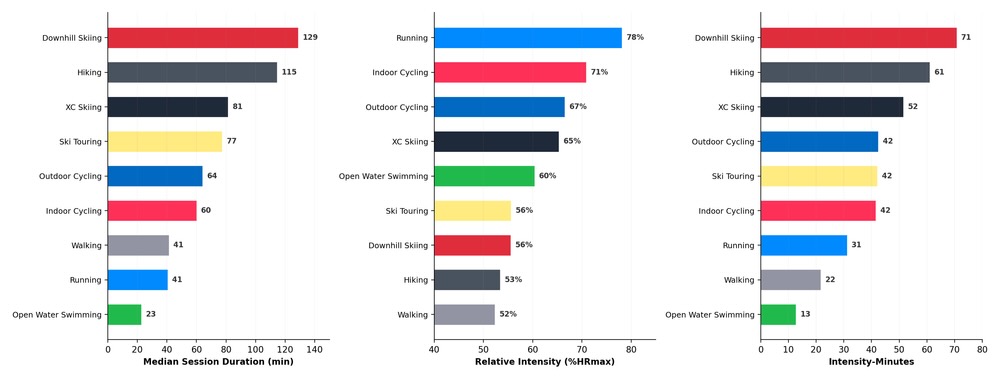
Well, in this calculation, downhill skiing – the least intense per minute – comes out on top with 71-intensity minutes, mainly because people tend to do it for long periods, with outdoor and indoor cycling mid-table but both above running.
We’ve got to say, though, that we don’t think much of this particular measurement, and it seems like Brownlee is on the same wavelength.
“Here’s the issue with a straight duration × intensity calculation: it treats every beat per minute equally. But going from 110 to 120 bpm is not the same physiological event as going from 160 to 170. Above the lactate threshold, the metabolic cost of exercise rises exponentially, oxygen consumption drifts upward, lactate accumulates faster, and recovery cost per minute increases sharply. A linear model ignores all of this.”
Exactly. If you sit on the sofa for a couple of hours with your heart rate at a constant 60 bpm – and your max HR is 180 – you’d come out with 40 intensity-minutes. You’d be hard-pressed to describe that as hard exercise – or any exercise at all, come to that – so Brownlee has done some weighted statistical analysis to make things a bit more meaningful.
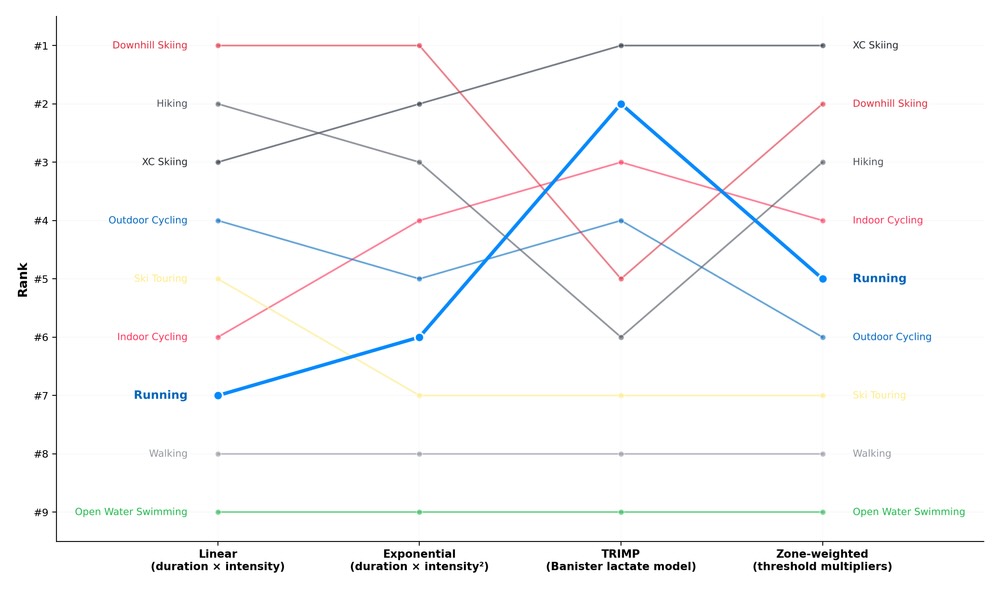
We won’t go into the whole lot (you can read the original article if you’re interested) but the TRIMP approach – which is described as “the academic standard” – put cross-country skiing at the top, followed by running, indoor cycling and outdoor cycling.
Of the four weighted approaches, this is actually the only one where running comes out ahead of either indoor or outdoor cycling.
We asked hugely experienced coach Joe Beer what he thinks. Joe has been coaching cyclists, triathletes and other endurance athletes for 35 years.
“Running requires more power for what people think of as “steady” (280W cycling is a solid FTP [functional threshold power], that’s a controlled top Z1 running). Many runners are still stuck in Z2 (on a three zone scale) ‘semi tempo’ running and don’t do base, so I think they have higher HR because they cannot possibly run slow.
“I agree that running is hardest on the body due to impact and the nature of genetics: we weren’t meant to run 13-26 miles as part of a pre-requisite to evolve. HR is still a poor way to measure actual body impact of the session, especially in athletes over 65 years of age.
“Running produces more consistent HR data – that we all know, and it means running is a quick way to get fit as HR and cardio load are keep solid throughout sessions of equal RPE (rate of perceived exertion) compared with cycle sessions or swims.
“People can cycle easy or moderate. If you run, you keep running and only walk when you have to so your HR stays higher.
“But really, does it matter? You need to keep HR controlled, and the majority of athletes are not training enough steady sessions because they believe they might be an Alistair Brownlee if only they push enough sessions hard enough. Nah, choose your parents well and probably get a time machine to go back and be more active as a kid/teen.”
Fair point, but we’re still interested in the original question: which is the hardest endurance sport? Hmmm! Well, it’s not easy, is it? If you’re hoping for a straight answer, you’re not going to get one here. It all depends what you mean by ‘hardest’ and how you measure it, which is pretty much where we started.
What’s the best endurance sport, though? That’s far easier. It’s cycling, no research necessary, and that’s an end to it…


 – plus Brooks upgrades legendary B17 saddle, new Van Rysel Menstrual bib shorts tackle “the realities of riding as a woman” + more")


40 thoughts on “Which is the hardest endurance sport? Double-Olympic triathlon champ Alistair Brownlee has crunched the stats to find out”
Mighty info
“If you sit on the sofa for a couple of hours with your heart rate at a constant 60 bpm – so your median HR was 100% of your peak HR – you’d come out with 120 intensity-minutes.”
I think the intensity is calculated as a % of your overall max HR, not the max HR recorded in a single activity. So if you have a max HR of 180BPM, and you sit on the sofa for two hours, you’d get a score of 120 x 33% = 40 intensity minutes.
Although that doesn’t change the conclusion that it’s a pretty flawed metric – its still claiming to be twice as “hard” as e.g. a flat out 5k run (20 minutes at 100% max HR = 20 intensity-minutes).
Yeah, you’re absolutely right, I got that example wrong. They’ve used the max HR that person has ever recorded as the basis for the calculation. I have altered the wording in the article.
It’s more basically problematic than that, in that it assumes your minimum heart rate is zero, which is fairly self-evidently nonsense. On this basis, I could accumulate a bunch of ‘intensity minutes’ just lying in bed.
Over a long enough time frame I fear all our heart rates revert to zero.
Just started running again. Cycling is definitely more fun.
Eeyore
I mean if you’re looking at endurance sports and not including rowing, which is a true full-body workout, you’re missing a key one.
Whereas Stone Age people were always going out for a couple of hours on the bike. 🤔
Sure, the Krebs cycle was around well before the dinosaurs, so it makes sense that cavepeople would use them to escape velociraptors.
Wouldn’t the velo-ciraptors have their own, though?
we weren’t meant to run 13-26 miles as part of a pre-requisite to evolve
We must stand firm against this insidious Lamarckism!
Good plan. We’ll evolve stronger quads as a result.
Fact.
I once read that humans initially had high concentrations of fast twitch muscle fibres, which equipped them to catch prey after a short sprint.
However, higher concentrations of slower twitch fibres developed along with a hunter gathered lifestyle in which prey became fatigued after being stalked over longer distances.
So humans did adapt the ability to run over longer distances as they evolved.
It is interesting that many world class sprinters are descendents of black West Africans and distance runners descendents of black East Africans. Presumably the terrain and climate and perhaps prey in East Africa is more suited to Endurance hunting.
East African success in distance running has a lot more to do with opportunity, culture and, to some extent, habituation to living at altitude, than it does with anything genetic.
I agree, they are important factors, but an endurance athletes genes (mainly their V02 max ) are around 80-90% responsible for their achieved level of performance.
You’re confusing individual level differences with population level ones, though.
I was a very committed county standard club distance runner. I trained bloody hard and probably got the best out of myself that my physical limitations would allow.
Had I immersed myself in Ethiopian or Kenyan culture from an early age and gone to live and train there at altitude, I would still not have been capable of breaking 14 mins for 5k.
However, some of my more talented club mates probably would have done
Culture? I think learning Ahmaric might be harder for me than running a marathon…
Ahmaric is a piece of piss once you master the irregular verb endings and the Bekele Pluperfect tense.🙂
I think the most important point is not the activity, but the endurance and intensity.
In my running days, I always found 1500m and 800m much harder and more painful than say 5k or 10 miles. In these shorter events you are training your body to deal with oxygen debt from from the early part of the event.
In cycling I find 5, 10 or 25 mile time trials similar in feel to each other and to maybe 10k – 10 miles in running. Generally you do not exceed your aerobic capacity until the later stages.
I have never cycled a track pursuit, but I imagine it will be similar in feel to running 1500m and very painful compared to longer time trials.
I have never rowed. But I would imagine racing 2000m on a lake is tougher and more painful than say the boat race.
Rowing is an odd one, because you have (admittedly short) recovery time built into every stroke. This caps the intensity, so the difference in pain between 2k and 5k isn’t as great as it might be for other sports. That said, 2k ergs are still one of the most painful things I’ve ever done.
You don’t really get recovery time though do you? Maybe on a rowing machine where the mechanism pulls the rope back, but in a boat after each stroke you’re lifting the oar out of the water and pushing it back to begin the next stroke, so a period of lower effort but not recovery time. I agree it’s a bastard, the only time I’ve actually blacked out from exercise was on a rowing machine FTP test.
There’s skill required on the recovery on the water, but that’s different from putting in physical effort. You’re not doing anything that puts a significant strain on your system during that time. You can’t do a very short (10 seconds or so) hard burst when rowing in the same way you can on a bike or running.
I really think there are too many variables behind each sport category and the data sets are just averages of averages of averages of… And therefore deriving quite singular statements that one sport is more/less something than another is very problematic. Also, I am not at all an app guy, so I wonder can the apps or researches for example tell when the downhill skier is actually skiing downhill and is not on a lift, which can influence quite significantly the data? Again, I’ve no data to compare but my own, but to me for example the outdoor and indoor top median peak HR’s are way too low, especially if the data really is derived from “atheletes”. Therefore, again, something just does not feel right here.
The point I am making is that environment, training & culture can only take you so far, without the physical attributes of an elite athlete. Genetics are the foundation of athletic potential and achievement
This was in reply to mdavidford.
Yes – but it doesn’t follow from that that if country A produces proportionately more elite distance runners than country B, it must be because of ‘something in their genes’. If each country has proportionately the same number of people with the right genetic basis, but country A has an environment that is 5 times more likely to identify and nurture it, then country A is likely to produce 5 times more elite distance runners. The ‘something in their genes’ only really explains why *those particular people* made it, as opposed to other people *from the same background*.
Yes, but every country doesn’t have people with the correct genes in the same proportion.
A level 4 throws coach once commented (around 40 years ago) that if he stood on a street corner in London, a number x people with the build that had potential to be an Olympic shot putter etc would pass him in an hour. If he did the same in Bucharest, several times x would pass him in an hour.
A large proportion of the fastest sprinters on earth originated from a relatively small area of Jamaica.
Serbia is the tallest nation. Is that because they eat a lot of pork or because they play tennis and basketball?
Serbia is the tallest nation. Is that because they eat a lot of pork or because they play tennis and basketball?
Oh dear ! I knew Lamarckism would return to haunt us.
[citation needed]
In any case though, it’s missing the point. I didn’t claim that genetic differences were evenly distributed across every population. I was just demonstrating that it’s possible for those differences to be very important to the success of an individual, while being essentially irrelevant to the success of a country.
The argument still holds if we allow that there may be some small variation from country to country. In fact, in that case it’s quite possible that a country that has less of those people who are genetically lucky, but more success. If country A has 99 ‘genetic lottery winners’ to every 100 in country B, but is 5 times more effective at converting them into actual winners, it’s still going to be much more successful.
And the variations *are* small – genetic diversity *within* populations far outweighs differences *between* populations.
It’s not missing the point. I just happen to disagree with your argument.
Ok. Well it was *irrelevant* to the point, so either you were missing it or you were deliberately trying to muddy the question. I was just making the most charitable assumption.
The Dutch (and a few others) would like a word…
I read an article in the press a few months ago that had Serbia at number 1 and Netherlands at 2. Can’t remember who was 3rd. I can’t remember where, but the main thrust of the article was that very tall people had an extra chromosome (x I think).
But there are clearly higher concentrations of tallness genes in some countries.
Are you sure it’s not just cultural eg. their taller footwear (stilt clogs)?
Or eating lots of their excellent Old Amsterdam aged Gouda cheese.
No it’s obviously evolutionary, living in a land with large parts below see level you have to be tall to see the horizon.
No it’s obviously evolutionary, living in a land with large parts below see level you have to be tall to see the horizon.
Scientific principles being abandoned wholesale here! Kleinfelter syndrome XXY are tall, so tall males will carry an average of more than one ‘X’
From my personal experience as a triathlete, and all three sports done separately as well, XC skiing, the last one is the hardest of all. In XC skiing ( classic diagonal technique), I have the highest heart rate of all.