- News
- Reviews
- Bikes
- Components
- Bar tape & grips
- Bottom brackets
- Brake & gear cables
- Brake & STI levers
- Brake pads & spares
- Brakes
- Cassettes & freewheels
- Chains
- Chainsets & chainrings
- Derailleurs - front
- Derailleurs - rear
- Forks
- Gear levers & shifters
- Groupsets
- Handlebars & extensions
- Headsets
- Hubs
- Inner tubes
- Pedals
- Quick releases & skewers
- Saddles
- Seatposts
- Stems
- Wheels
- Tyres
- Tubeless valves
- Accessories
- Accessories - misc
- Computer mounts
- Bags
- Bar ends
- Bike bags & cases
- Bottle cages
- Bottles
- Cameras
- Car racks
- Child seats
- Computers
- Glasses
- GPS units
- Helmets
- Lights - front
- Lights - rear
- Lights - sets
- Locks
- Mirrors
- Mudguards
- Racks
- Pumps & CO2 inflators
- Puncture kits
- Reflectives
- Smart watches
- Stands and racks
- Trailers
- Clothing
- Health, fitness and nutrition
- Tools and workshop
- Miscellaneous
- Buyers Guides
- Features
- Forum
- Recommends
- Podcast
news
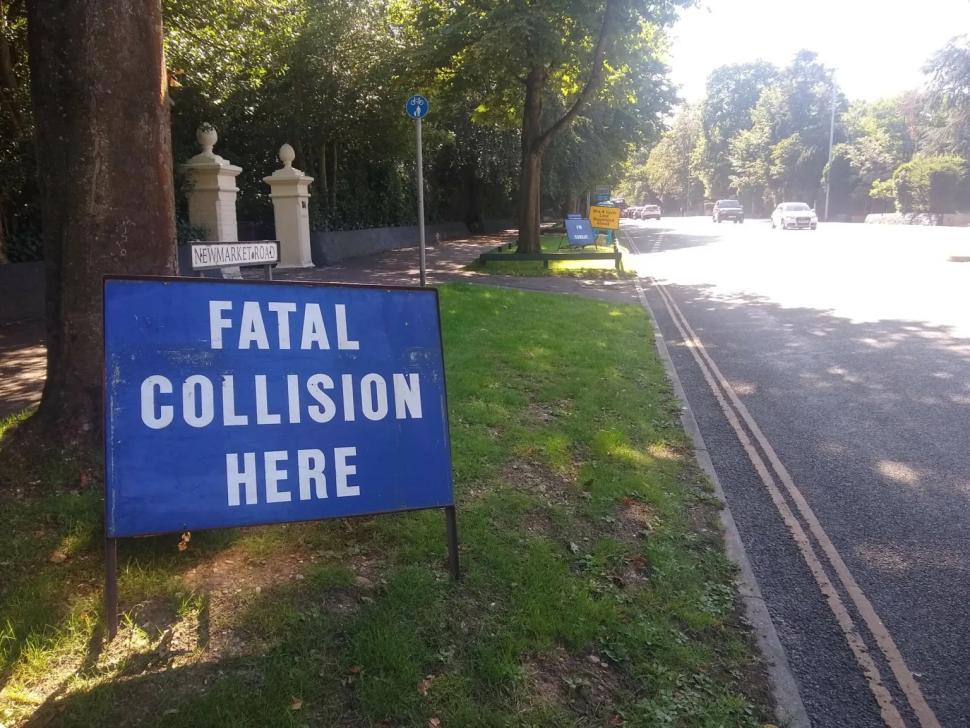
 Newmarket Road fatal collision sign, Norwich (credit: Peter Silburn)
Percentage of cyclists killed or injured on UK roads dropping more than any other road user, new government figures reveal – but safety campaigners say number of fatalities “remain stubbornly high”
The number of cyclists killed on British roads has fallen by five per cent, more than any other category of road user over the past year, while the overall casualty figures for people riding bikes have also dropped by six per cent, the Department for Transport’s latest road safety statistics have revealed.
According to the DfT’s new estimates for the year ending June 2024, cyclist fatalities have fallen once again to their lowest number since records began 45 years ago, marking a 27 per cent drop compared to the same period in 2014.
Meanwhile, reported road casualties for people on bikes are also 33 per cent lower compared to a decade ago.
Released on Thursday, the Department for Transport’s ‘Reported road casualties in Great Britain, provisional estimates’ details the number of personal injury road traffic casualties which were reported by the police between July 2023 and June 2024.
Overall, during this period, there were there were 29,540 killed or seriously injured (KSI) casualties on British roads, of which 1,607 were fatalities, a decline of two per cent compared to the previous year.
The number of casualties of all severities also saw a drop of four per cent, totalling 128,920 for the year ending June 2024.
83 cyclists were killed on British roads during this period, making up five per cent of all fatalities. For comparison, 45 per cent of road deaths were car occupants, 24 per cent were pedestrians, and 20 per cent motorcyclists.
The number of cyclists killed, 83, also dropped by four from 87 the previous year, the biggest percentage fall for any road user group, and 27 per cent lower than the fatality rate recorded in 2014.
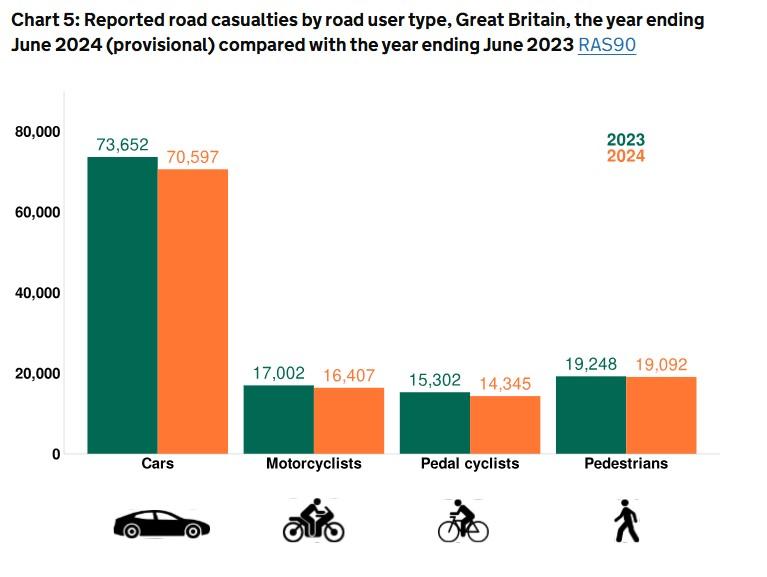
This trend continues when examining overall casualty figures. Again, car occupants make up the largest share of all reported road casualties, with 55 per cent, with pedestrians making up 15 per cent, motorcyclists 13 per cent, and cyclists 11 per cent.
14,345 cyclist casualties were reported between July 2023 and June 2024, a fall of six per cent from the 15,302 reported the previous year. By contrast, pedestrian casualties remained largely static, falling by just 56 to 19,092.
The number of cycling casualties in 2023/24 is also 33 per cent lower than the same period a decade ago.
Of course, the continued downward trajectory of cycling casualties in the UK must be weighed against the ongoing decline in cycle traffic, with the DfT’s annual report for 2023 showing that the number of miles travelled by bike fell by seven per cent compared to the previous year, a marked trend of the post-pandemic period.
Despite the continued drop in cycling collisions, safety campaigners IAM RoadSmart have also said the latest overall road safety figures show that the number of fatalities in Britain remains “stubbornly high”.
“Provisionally, the number of fatalities on our roads remains stubbornly high and underlines the importance of the government’s commitment to an updated road safety strategy,” IAM RoadSmart’s director of policy and standards Nicholas Lynes said in response to the new data.
“Of particular concern appears to be an alarming spike in the number of young women killed in the past 12 months,” he continued, referencing the 25 per cent rise in fatalities for women aged 17 to 29 on the roads.
“It’s vital that the government looks at all solutions that could reduce deaths on our roads, including the improvement of driving skills, managing in-vehicle distractions and effective enforcement of the so-called ‘fatal four’: speeding; drink or drug driving; not wearing a seatbelt; and using a mobile phone.”
“Seamless door-to-door journeys”
The DfT’s latest statistics have been published on the same day transport secretary Louise Haigh launched her new integrated transport strategy for England.
The Labour minister’s ten-year Integrated National Transport Strategy aims to provide a “people first approach” by supporting local areas to improve all forms of transport and provide “seamless” journeys from door to door, building on the example set by Greater Manchester’s multi-faceted Bee Network, which brings together bus, metro, and active travel under one name.
“Integrated transport in this country is lagging behind our European counterparts, and for too long our fragmented transport networks have stunted economic growth and made it harder for people to get around,” Haigh said at Leeds Civic Hall on Thursday.
“Today, I’m launching a new national vision of transport that seamlessly joins all modes of transport together, and puts people at the heart of our transport system.
“I want everyone to be able to contribute to this vision and have launched a call for ideas on how the strategy can best deliver greater opportunity, healthier communities, and better lives.”
The new strategy has been praised by Cycling UK, who nevertheless pointed out that for Haigh’s plans to succeed, Labour must provide long-term investment in active travel.
“We warmly welcome the Secretary of State’s vision for an Integrated Transport Strategy and her intention to put people at the heart of it,” Sarah McMonagle, director of external affairs at Cycling UK, said today.
“We have long called for a strategy that connects cycling with public transport to bring our network up to the standards we see in other European nations. Better integration with trains and buses means more affordable and sustainable travel. Communities deserve a transport system that enables more people to choose cycling, whether for everyday trips or as part of longer journeys.
“Investment in cycling has countless benefits, from strengthening local economies to reducing pollution and improving public health. We welcome the commitment from the Secretary of State to promote walking and cycling for shorter journeys.
“For the strategy to succeed and to meet our environmental commitments, we need to see clear targets on traffic reduction as well as long-term investment in active and sustainable transport.”
After obtaining a PhD, lecturing, and hosting a history podcast at Queen’s University Belfast, Ryan joined road.cc in December 2021 and since then has kept the site’s readers and listeners informed and enthralled (well at least occasionally) on news, the live blog, and the road.cc Podcast. After boarding a wrong bus at the world championships and ruining a good pair of jeans at the cyclocross, he now serves as road.cc’s senior news writer. Before his foray into cycling journalism, he wallowed in the equally pitiless world of academia, where he wrote a book about Victorian politics and droned on about cycling and bikes to classes of bored students (while taking every chance he could get to talk about cycling in print or on the radio). He can be found riding his bike very slowly around the narrow, scenic country lanes of Co. Down.
Latest Comments
- Rendel Harris 18 min 7 sec ago
As I understand it, the maintenance track beside the busway is and always has been designated a bridleway so it was in fact always a route that...
- don simon fbpe 1 hour 9 min ago
I'd go for 'the sun was in my eyes' as a defence, get away with murder with that one...
- PRSboy 2 hours 52 min ago
I have two aero bikes- an Argon18 Nitrogen and an Orro Venturi. I love the way they feel on the road. I also like the style of the deeper section...
- ridein 4 hours 49 min ago
I wonder if you could use a Northwave shoe (w/Speedplay drilling) on the Ekoi pedal. Possibly using one Look pattern cleat hole and two Speedplay...
- Rendel Harris 10 hours 29 min ago
They have here: results at 14.40. The aero bike was roughly fifteen seconds faster than a climbing bike on a descent of around 6 km, so about 3km/h...
- wtjs 10 hours 43 min ago
As I've also placed here the nutter Audi and white van drivers, I've decided to give those no-nonsense keep-the-country-moving BMW drivers a list...
- polainm 11 hours 46 min ago
100% this. Policing mentality is formed by social 'norms', and the cyclist witchhunting across social media is the UK norm. Close passing a person...
- David9694 13 hours 11 min ago
That's a clear 2 points awarded there, but I guess as there's now a 25% tariff you'll only get 1.5
- mark1a 13 hours 22 min ago
Fawkes Cycles is only local if you live near Oldham. That's nearly 300 miles away from me. Also, any retailer that doesn't participate in an...
- David9694 13 hours 25 min ago
Openreach under fire over delays to Amesbury cabinet repairs...


Add new comment
9 comments
So that's an increase in KSI per mile, if falls are 5 and 6% but miles cycled has decreased 7%, increases of 2% and 1% killed / seriously injured.
Not sure that's statistically significant but it's not a "good news" story sadly.
Either due to normal fluctuation or reduced levels of cycling i.e. not a real reduction.
The casualty figures are astonishingly high.
What these figures don't show is casualties per distance travelled.
Then I think we would see that driving a car is the safest mode of transport whilst the safety of pedestrians and cyclists massively suffers at the expense of keeping motor traffic flowing as fast as possible. Why is walking around so dangerous?
Also, it would be helpful to know whether the year-on-year reductions are actually statistically significant and at what level.
It says that miles cycled have dropped by 7% which makes a only a 5% drop in fatalities look very poor. Maybe the headline should highlight this?
The context to that graph is set by the one below.
The only period of sustained reduction in road deaths in a generation was when the Blair Government set a target to halve them in 10 years, which was achieved.
The Conservative led coalition Government killed that in ~2011, and decided to sit on their butt, and then politicise road safety. Hence the numbers not changing, a road safety review promised in 2014 nerver happening, a series of self-serving transport ministers, Mark Harper embracing conspiracy theories about globalism, and Welsh Conservatives suddenly doing a reverse-ferret on 20mph having strongly supported it, and ultimately the Plan for Drivers and road safety being made a culture war wedge issue to save the miserable Tory arse.
All resulting in no statistical changes since then, and the UK tumbling internationally from "top of the table" to "top of the main clump". Now the argument I hear from the "don't change it lobby" is "but we are better than average, and deaths will always happen". Let them tell that to
We need a target for 2030, and a raft of measures, and a supporting strategy.
I'd suggest we want road deaths reduced to under 1300 per annum in 5 years, and under 1000 per annum in 10 years. Or alternatively reduction by 1000 per annum, or maybe half, which will be to more like 700-800.
Generally agree but with caveat - we have over time achieved "road safety" at the expense of vulnerable road users (eg. their convenience, or ability to get anywhere useful). So to a first approximation it's been "make it safer to drive with less care" while allowing people's fear and the lack of convenience to drive more of them to ... drive.
I don't think that's a good bargain - we'll have more problems sooner (running out of space / resources / or even robotaxis taking over, monopolising transport and rendering streets off-limits in some dystopian visions).
I would propose using the exposure metric eg. our crude KSI per billion journey-kilometers. (Or something more granular eg. taking in to account the infra type / location). To hopefully allow us to say at some future date "yes, the actual cycling casualty numbers went up the last x years - but that is because we have a *lot* more people cycling (and walking). And because it feels so safe and convenient many of them are eg. quite old and this increase represents a similar one to if eg. they were just walking more, rather than driving". (And for bonus "and here were beginning to see some improvement in stats for "diseases of inactivity"...)
It's this more "holistic" view of transport and what we want from it (and indeed our public spaces in general) which makes me appreciate the directiin of the NL "Sustainable Safety" vision, rather than just "Zero deaths!" (well yes, but how are you going to actually achieve that, and what are the consequences of the measures to get there?)
But (good - but also bad for "urgency to change anything") rather low compared with most other "western" countries.
They give the figures for numbers of all casualties so should be possible to work this out?
According to the results of last year (and previous decade) for *fatalities*:
most dangerous (per distance) to walk (although a couple of years motorbikes had slightly higher numbers).
That changed with Covid / the lockdown. I wonder if there was a methodology / measurement change here also or this genuinely reflects a significant change in different travel patterns? Because since then cyclists have been least likely to die per unit travel, then pedestrians, with cars and motorcycles the most. Albeit the trends seem to be rising again for pedestrians / cyclists and falling for motorised road users...
Not sure about the statistical significance (note that HGVs are not shown, presumably because of very low numbers).
https://www.gov.uk/government/statistics/reported-road-casualties-great-...
That chart indexes all modes to 100 in 2013, so shows that cyclists have had the steepest drop, but doesn't tell you anything about the relative fatality rates. The table below the chart on the same page gives fatality rates per billion miles: motorcyclists top (111), followed by pedestrians and cyclists (27/24), then car drivers (3)
Apologies - you're quite right! Something about presentation and comprehension...