

A data-mapping specialist has used Transport for London (TfL) traffic data to show how bicycles are becoming the most used mode of transport at some locations in the capital at certain times of day.
Oliver O’Brien, a research assistant at the Centre for Advanced Spatial Analysis at University College London, used TfL Traffic Census Data to produce what he has called the London Cycle Census Map. You can find it here.
The data, not made publicly available by TfL but obtained via London’s Cycling Commissioner Andrew Gilligan, were collected at 170 locations in central London in April this year.
Drop down menus on O’Brien’s map enable the data for each location to be segmented by vehicle type and by time of day.
The former comprise cars, taxis, motorbikes, vans, lorries, buses, bicycle, others, and all.
Up to three different modes of transport can be compared, or the second and third fields simply left blank.
The time periods are morning peak (7am to 10am), afternoon peak (4pm to 7am), and all day (6am to 8am).
Again, comparisons are possible, for instance you can set the map to show bicycle usage in the morning and evening peaks.
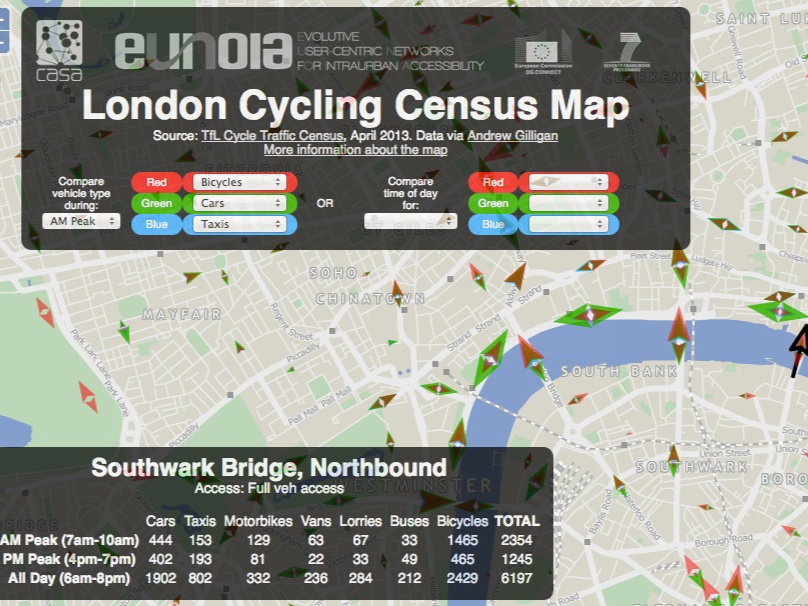
Clicking on the individual data points on the map brings up the full dataset for that location.
For instance, clicking on Southwark Bridge northbound (see screenshot above) reveals that in the morning peak, 1,465 of the 2,354 vehicles crossing in that direction were bicycles.
That's equivalent to 62 per cent of the traffic crossing the bridge during the three-hour morning peak, outnumbering cars by a factor of more than 3 to 1.
The data also reveal different routes favoured by users of different modes of transport as they cross the city centre.
Writing on his blog, O’Brien explains:
There are certain routes which are popular with certain kinds of traffic. There are four main east/west corridors in central London. Cars dominate the north-most (Euston Road) and the south-most (Victoria Embankment) ones. Taxis heavily use Holborn, while cyclists mainly use Old Street/Theobalds Road.
He adds, however, that there is no similar pattern when it comes to the north-south axis.
Further data relating to the resurgence of cycling as a form of transport in London can be found in this Technical Note from TfL’s Roads Task Force, called How has cycling grown in London and how will it grow in future?
This isn’t the first time we’ve featured O’Brien’s work here on road.cc. In August 2010, shortly after the Barclays Cycle Hire Scheme was launched, he produced an interactive map that used real-time data to show usage of the blue Boris Bikes.
He also discovered through TfL data that in 2011, Christmas Day – when bus and tube networks shut down – saw what was at that point the highest level of simultaneous use of the scheme.


4 thoughts on “New map based on TfL data shows cycle traffic flows in central London”
I assume then that 60% of the
I assume then that 60% of the roads will be allocated to bikes during those peak times then…
Playing devil’s advocate
Playing devil’s advocate …
The obvious flaw in the data is that it counts vehicles not passengers. So bicycles massively outnumber buses across the capital during peak hours, but I’d be surprised if cyclists outnumbered bus passengers. Is there a similar (but smaller) pattern with cars?
b3nharris wrote:Playing
I’d be very surprised if TfL didn’t have bus occupancy data to enable this to be addressed.
However the real power of the data set would be in the design and justification of cycle infrastructure which reassigned road space away from general traffic. It’s one thing to try and carry the argument when cycles are 20% of the traffic on a ‘if we build it they will come’ basis, quite another to say ‘we are building it to improve the experience of the majority of road users’.
Very interesting would be
Very interesting would be nice to have this data for more roads. My commutes are on those roads where cycles outnumber cars. Mapping more data would allow cyclists to choose routes that have a greater number of cyclists, effectively creating our very own cycle routes!