Bike
Components
Accessories
Clothing
Health, fitness and nutrition
Tools and workshop
Miscellaneous
Road bikes
Sportive and endurance bikes
Gravel and adventure bikes
Urban and hybrid bikes
Touring bikes
Cyclocross bikes
Electric bikes
Folding bikes
Fixed & singlespeed bikes
Children’s bikes
Tandems
Frames
Accessories – misc
Computer mounts
Bags
Bar ends
Bike bags & cases
Bottle cages
Bottle
Cameras
Car racks
Child seats
Computers
Glasses
GPS units
Helmets
Lights – front
Lights – rear
Light – sets
Locks
Mirrors
Mudguards
Racks
Pumps & CO2 inflators
Puncture kits
Reflectives
Smart watches
Stands and racks
Trailers
Arm & leg warmers
Base layers
Gilets
Gloves – full finger
Gloves – mitts
Headwear
Jackets
Jerseys – casual
Jerseys – long sleeve
Jerseys – short sleeve
Overshoes
Shoes
Shorts & 3/4s
Skin suits
Socks
Tights & longs
Underwear
Trousers
Bar tape & grips
Bottom brackets
Brake & gear cables
Brake & STI levers
Brake pads & spares
Brakes
Cassettes & freewheels
Chains
Chainsets & chainrings
Derailleurs – front
Derailleurs – rear
Forks
Gear levers & shifters
Groupsets
Handlebars & extensions
Headsets
Hubs
Inner tubes
Pedals
Quick releases & skewers
Saddles
Seatposts
Stems
Wheels
Tyres
Energy & recovery bars
Energy & recovery drinks
Energy & recovery gels
Heart rate monitors
Hydration products
Hydration systems
Indoor trainers
Power measurement
Skincare & embrocation
Sun care
Training – misc
Cleaning products
Lubrication
Tools – multitools
Tools – Portable
Tools – workshop
Workstands
Apps
Books, Maps & DVDs
Camping and outdoor equipment
Family
Gifts & misc
All
How To
Tech
Fitness
Travel
Bike Forum
Tea Stop
Back
Bikes
Time trial bikes
Bottles
Cross country mountain bikes
Tubeless valves
Meanwhile, Oxford and Cambridge are named university bike theft hot-spots
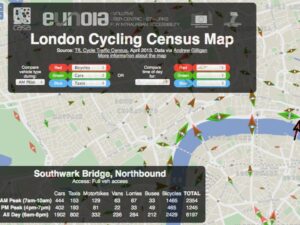
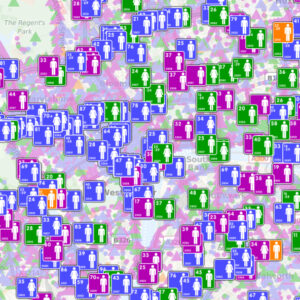
UCL researcher's map also enables different modes of transport and times of day to be compared
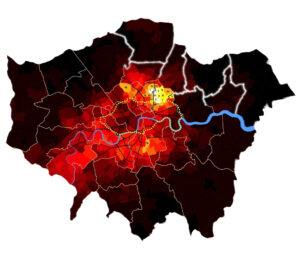
Law firm Bolt Burden Kemp's map highlights hot and cold spots
Bike use more than doubles in city centre from 2001-10 - but it's a different story in some outlying boroughs
Visualization produced by data mapping specialists ITO World for See Me Save Me
Meanwhile, reporters live blog from their day following London Ambulance Service
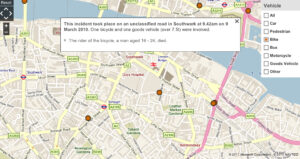
Searchable and zoomable interactive map shows incidents by severity, class of user and age of victim