

A little over a fortnight since we reported on ITO’s interactive map of road traffic casualties in Great Britain, the BBC has now produced its own set of graphics highlighting, among other things, the death toll on the country’s roads.
As far as we can tell, the local maps the BBC has produced showing road traffic fatalities in specific areas, searchable by postcode, are based on the same dataset used by ITO to produce its map, although the latter also included incidents resulting in severe or other injuries.
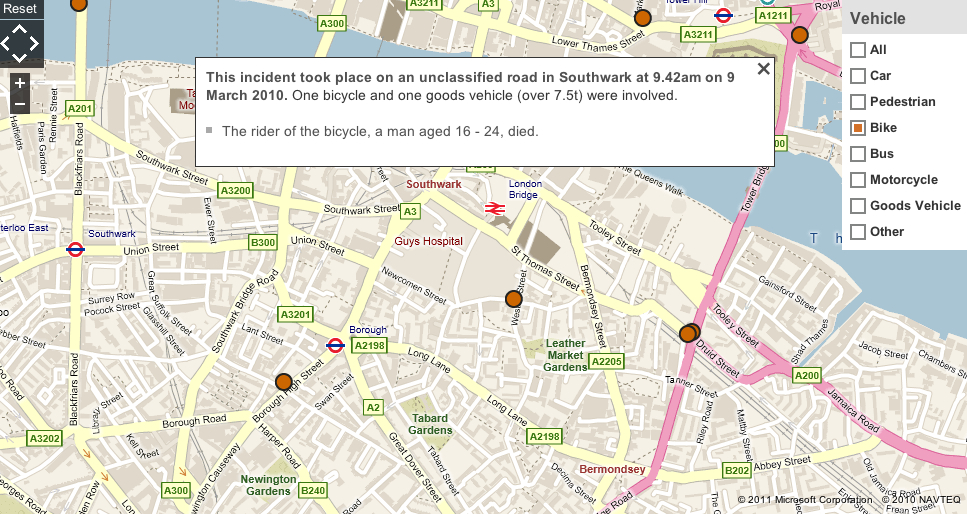
The map, which is zoomable and can also be scrolled around, is searchable by class of road user, and clicking individual incidents will bring up brief details.
There do appear to be some gaps – the death of a cyclist in Bath that we are aware of is shown on neither the ITO nor the BBC maps.
Other graphics in the series produced by the BBC address different facets of road safety.
One, under the tab ‘Twin Peaks,’ shows the distribution, throughout the day, of cyclist casualties on the country’s roads between 1999 and 2010.
Unsurprisingly, during the week, spikes are observed at both the morning and evening rush hours, while on Saturdays and Sundays, midday to 6pm are the times of day that see a heightened level of incidents.
Another slide, with the title ‘Dangerous Driving,’ highlights the relationship between various classes of road user found to be at fault for collisions and their driving history or criminal record.
The BBC saying that preliminary research from South Yorkshire Police has established that in one in every two road traffic collisions resulting in a fatality, the motorist responsible has a criminal record.
It also cites separate research that shows that 61 per cent of van drivers, 56 per cent of lorry drivers and 50 per cent of bus drivers deemed at fault for collisions have a prior motoring offence.
That compares to 39 per cent of those driving cars and, as further evidence that cyclists and motorists are very often the same people, 38 per cent of cyclists.
Lorry drivers who are held to be at blame for a crash are the most likely to have a prior criminal record at 41 per cent, followed by cyclists and van drivers, who tie for second place at 35 per cent.
Meanwhile, BBC reporters are spending today with the London Ambulance Service so they can get first-hand experience of the scale of the issues facing paramedics and others who deal with the aftermath of road traffic collisions on a daily basis.
The reporters are live blogging events on the BBC website, with one reporting how traffic continued to pass within inches of the head of a female motorcyclist as she was being treated after a fall from her bike in Chiswick.
The live stream includes a comment from Carlton Reid, executive editor of BikeBiz, who took the BBC for task over its reporting of one incident.
“A BBC reporter said a cyclist who injured an ankle should have been wearing a helmet, although there was no information given on how a cyclist should wear a helmet just above the foot,” he wrote.


, Portland’s world record ambitions, another e-bike brand goes pop + more")