- News
- Reviews
- Bikes
- Accessories
- Accessories - misc
- Computer mounts
- Bags
- Bar ends
- Bike bags & cases
- Bottle cages
- Bottles
- Cameras
- Car racks
- Child seats
- Computers
- Glasses
- GPS units
- Helmets
- Lights - front
- Lights - rear
- Lights - sets
- Locks
- Mirrors
- Mudguards
- Racks
- Pumps & CO2 inflators
- Puncture kits
- Reflectives
- Smart watches
- Stands and racks
- Trailers
- Clothing
- Components
- Bar tape & grips
- Bottom brackets
- Brake & gear cables
- Brake & STI levers
- Brake pads & spares
- Brakes
- Cassettes & freewheels
- Chains
- Chainsets & chainrings
- Derailleurs - front
- Derailleurs - rear
- Forks
- Gear levers & shifters
- Groupsets
- Handlebars & extensions
- Headsets
- Hubs
- Inner tubes
- Pedals
- Quick releases & skewers
- Saddles
- Seatposts
- Stems
- Wheels
- Tyres
- Health, fitness and nutrition
- Tools and workshop
- Miscellaneous
- Cross country mountain bikes
- Tubeless valves
- Buyers Guides
- Features
- Forum
- Recommends
- Podcast
news
Strava's 2015 in numbers - 4 billion km ridden worldwide
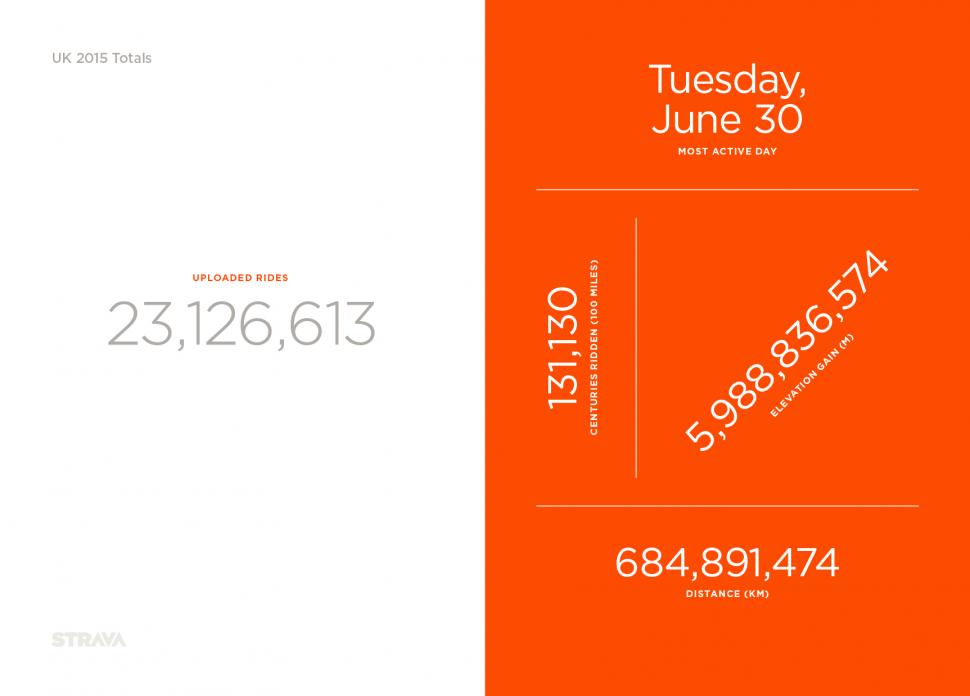
Strava Insights for 2015 reveal that cyclists in the UK uploaded more than 23 million activities to the ride-tracking app and website, with the busiest day surprisingly being a Tuesday – although that day, 30 June, coincided with a 24-hour walkout by London Underground staff.
Cracking weather, plus the fact it remained light well into the evening are likely to have boosted the number of Strava users who decided to take to two wheels for their commute on 30 June when RMT and TSSA union members stages a 25 hour walkout on the Tube.
The sheer volume of Strava users in the capital – more than four times as many activities were logged in the capital during the year than in the next most popular location, West Yorkshire – may have skewed the figures for that day, too.
The main picture above is a heat map showing all activities in the UK in the past 12 months.
Worldwide, more than 115 million rides were uploaded during the year with an aggregate distance in excess of 4 billion kilometres, with Sunday 7 June the most active day.
One in five rides logged globally were in the UK, for a total of 23 million, with nearly 685 million kilometres ridden.
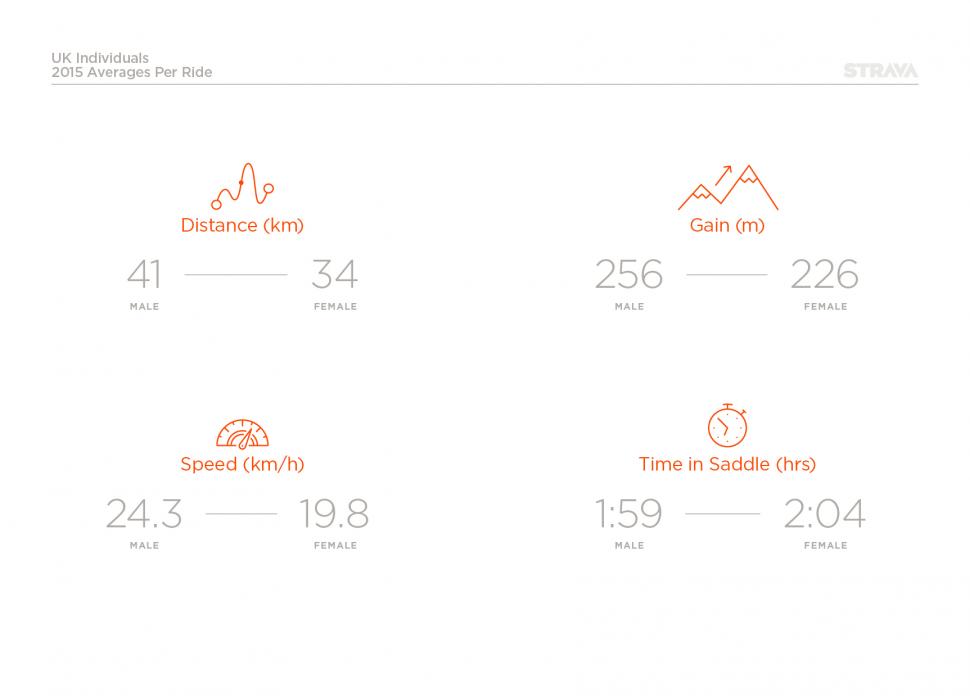
In a typical UK ride, men rode further and faster than women, and climbed more – but females spent longer in the saddle.
Cumulatively during the year, however, men in the UK put in more than twice as many kilometres as women did.
The flat landscape of the east of England helped cyclists in Lincolnshire and Cambridgeshire put in the fastest average speeds across the year, the two counties split only by Warwickshire.
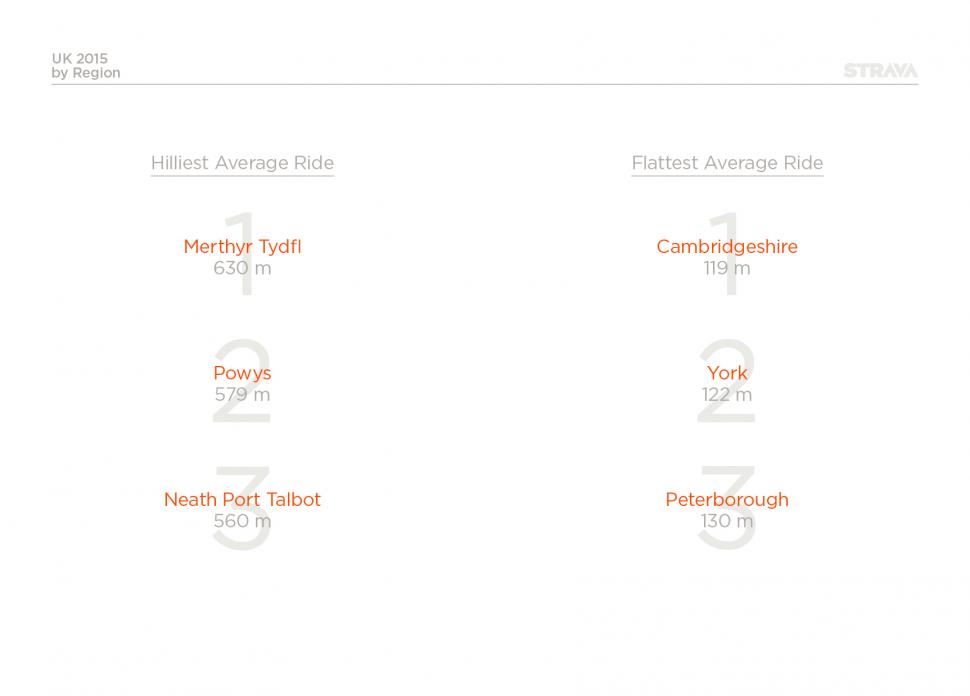
By region, rides in South and Mid-Wales saw the highest average height gain across the 12 months – we imagine that riders from elsewhere taking part in events such as the Dragon Ride, which is based in Port Talbot, may have boosted the figures there.
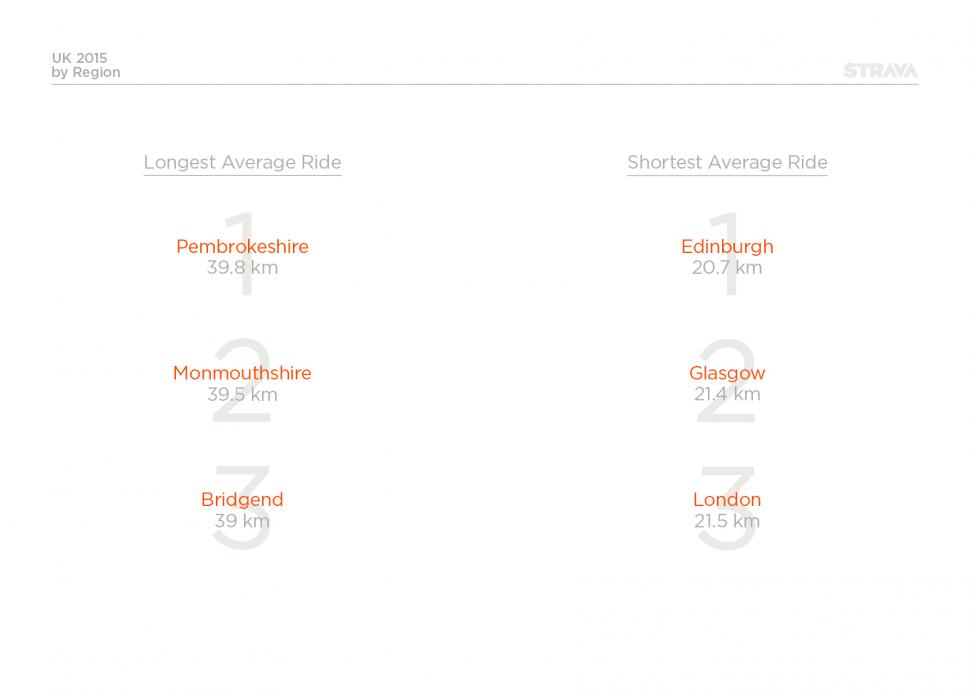
Wales also had the top three areas when it came to average ride distance, while the lowest were in London, Glasgow and Edinburgh – the latter due to a combination, we assume, of geographical area and the commuting effect.
The most popular day for commuting, unsurprisingly, was Tuesday 30 June with total distance ridden breaking the 1 million kilometre barrier – most of that in London due to the Tube strike, we’d guess.
The average ride to work takes a shade under 40 minutes at a speed just under 24kph – but half of cycle commuters leave the bike at home in the winter months.
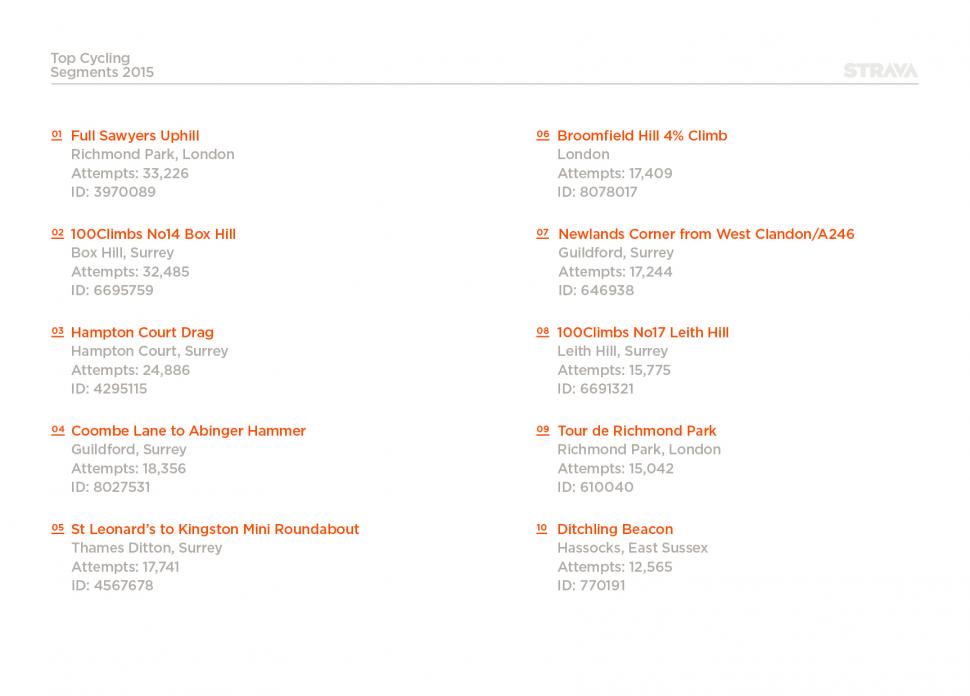
The top 10 segments were all in London or Surrey with the exception of Ditchling Beacon on the South Downs in East Sussex, which rounds off the list. The UK’s biggest mass participation event, the RideLondon-Surrey 100, may be a factor here – but even so, the ascent of number-one placed Sawyers Hill in Richmond Park was ridden an average of 639 times a week.
If you want to see how your figures stack up against the ones shown here, don’t forget you can check out your own year in an animated film – more details here.
http://road.cc/content/news/174018-relive-your-year-strava-personalised-animated-film
Simon joined road.cc as news editor in 2009 and is now the site’s community editor, acting as a link between the team producing the content and our readers. A law and languages graduate, published translator and former retail analyst, he has reported on issues as diverse as cycling-related court cases, anti-doping investigations, the latest developments in the bike industry and the sport’s biggest races. Now back in London full-time after 15 years living in Oxford and Cambridge, he loves cycling along the Thames but misses having his former riding buddy, Elodie the miniature schnauzer, in the basket in front of him.
Latest Comments
- Barraob1 14 min 8 sec ago
Locals furious because lazy able bodied people have lost an extra space.
- chrisonabike 48 min 58 sec ago
Are they sure it hasn't been there since the neolithic? It looks in keeping with e.g. some of the local menhirs? Although the other ones near St....
- David9694 1 hour 31 min ago
Car crash in The Butts in Worcester but driver not a scene...
- David9694 1 hour 36 min ago
This could catch on: Drivers 'not going out at night' because of bright headlights issue
- David9694 1 hour 37 min ago
My Pedros are yellow - I'm a no on them because the design is too chunky. ...
- Barraob1 2 hours 23 min ago
Is that justification for murder?
- ktache 2 hours 31 min ago
I have recently obtained a SPD axle removal tool from eBay, ali, anodised in blue, wanted orange. I presume it's Chinese made, too much of a...






Add new comment
6 comments
"half of cycle commuters leave the bike at home in the winter months"
Do they walk? Does the car traffic on these routes go through the roof for 6 months? Perhaps they not really commutes. Does the software differentiate between commutes and longer rides?
I know people like stats and I think the heat map can be useful but these summaries are meaningless: Surrey is hugely popular; mid-Wales is hilly and people riding there do longer rides than in cities; most Mamils don't ride in winter. None of these constitutes a revelation.
In the end this dataset is only the GPS-enabled (and uploading) minority of the pedalling population. Still, Strava know how to get some good publicity.
Well you can flag a ride in Strava as a commute, so it is up to the rider.
I love stats. It is the whole reason for logging data on this sort of platform. Suprised that the average annual totals are so low, i rode 13,600 km last year. I suppose the vast number of short commutes skews that figure downwards.
I'm surprised the cumulative total (males) for the year is only 832 km. I did over 2,000 miles just on leisure rides alone, excluding commuting (which I don't record - about another 2,000 miles).
Awesome... Great job on the graphics Strava!
Leviathan - I run an informal time trial for my Tri club and I can see the route used for that too!
Cool, I can actually see my loop around Manchester Airport on that map. It must be because of how great I am (or because the airport is in the way.)