

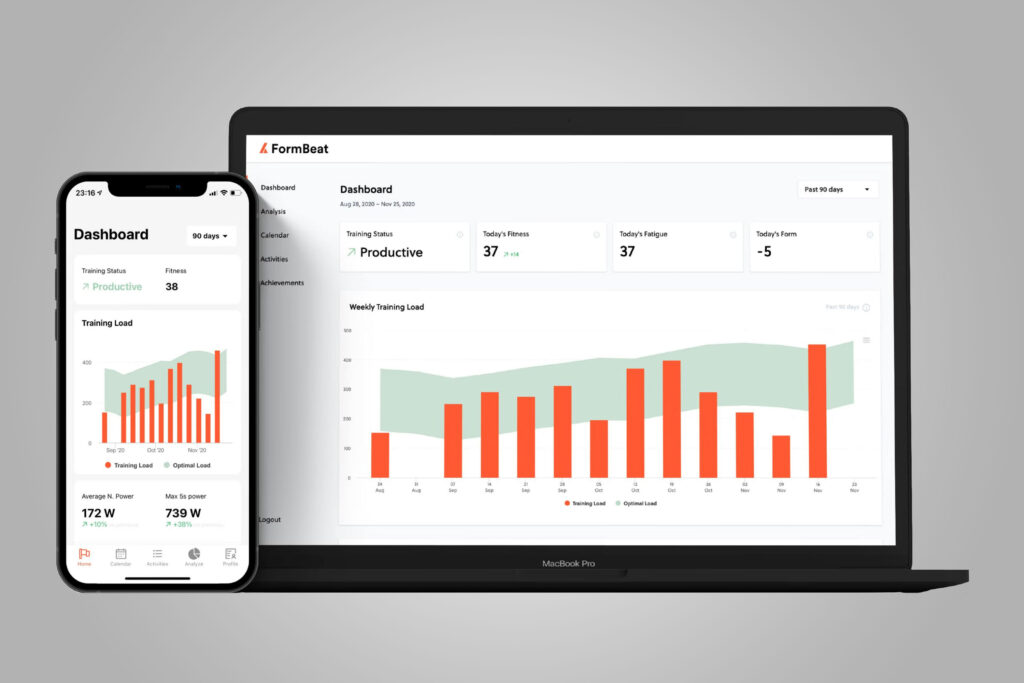
The FormBeat analytics tool provides a simple layout for easy analysis on your laptop or desktop, and its low price is perfect for those just getting into training analysis. However, the limited analysis via the phone app makes it far less useful than the best cycling training apps if you don’t have access to a computer, such as when you’re on the road at races.
FormBeat boasts simple, clutter-free graphs that are easy to understand, but maintains the ability to analyse lapped intervals. Unlike TrainingPeaks Premium however, there’s no ability to plan training or have a coach set it for you, so you can only look at previous rides you have done.
> Buy this from FormBeat now for $25 a year
It’s important to mention that FormBeat relies on files uploaded to Strava, which are then imported with the power and lap data for analysis. The upside is that you don’t need to connect your bike computer’s supporting app (Garmin Connect or Wahoo ELEMNT, for example) to your FormBeat account, as the files are just synced straight over. The downside is you have to upload everything to Strava first, which isn’t always convenient; for instance I usually don’t upload my gym workouts to Strava, but they do influence my training load.

If you are new to riding with a power meter – and we have plenty of reasons why you should use a power meter – analysing one can be daunting, and advanced software such as TrainingPeaks can really put you off. FormBeat keeps graphs simple, has an intuitive layout and gives a great overall picture of how your progression is looking, so it’s ideal if you’re still finding your feet.
However, if you are a data nerd like me, you might find some of the values a bit too basic, or that they can be accessed using the Strava Sauce extension for free. Also, It lacks detailed metrics such as power-to-heart-rate ratio to analyse your heart rate drift on longer rides, left-right power balance, and intensity factor, all things the admittedly more expensive TrainingPeaks Premium offers.
Home screen
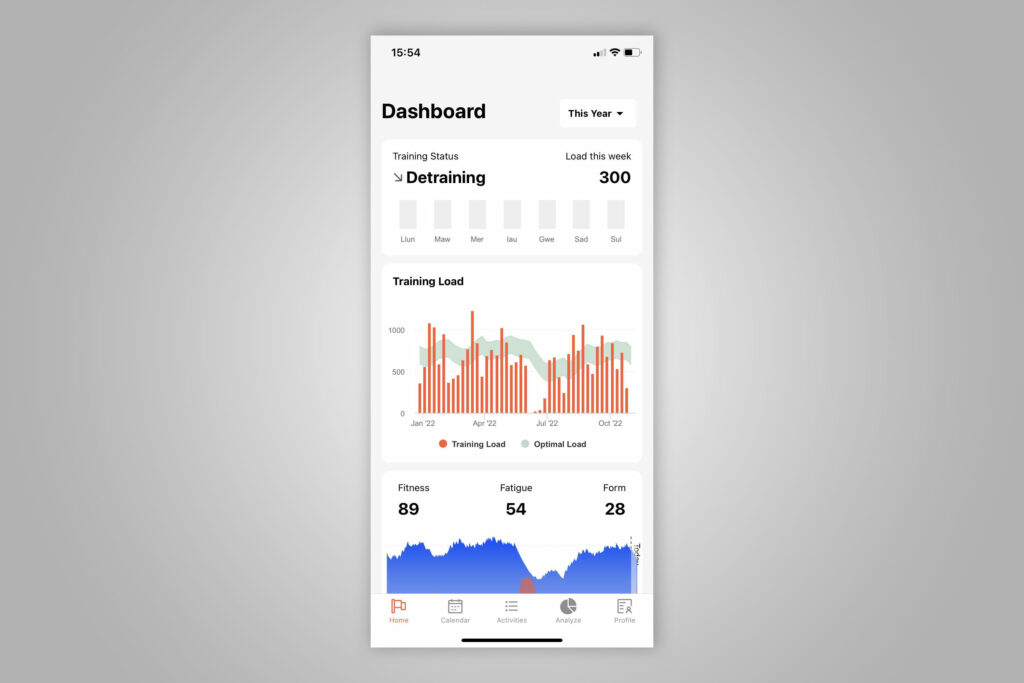
Your home screen provides some of the most suitable graphs including variations of your training status; my personal favourite is the fitness graph for the current calendar year, which shows any longer recovery sections (for me, that includes time off in June to recover from my broken collarbone and scaphoid).
Further down, there is the all-important power curve to show the type of rider you are and where your weaknesses lie. Personally I find the Strava Premium power curve much easier to interpret, but it’s fine.
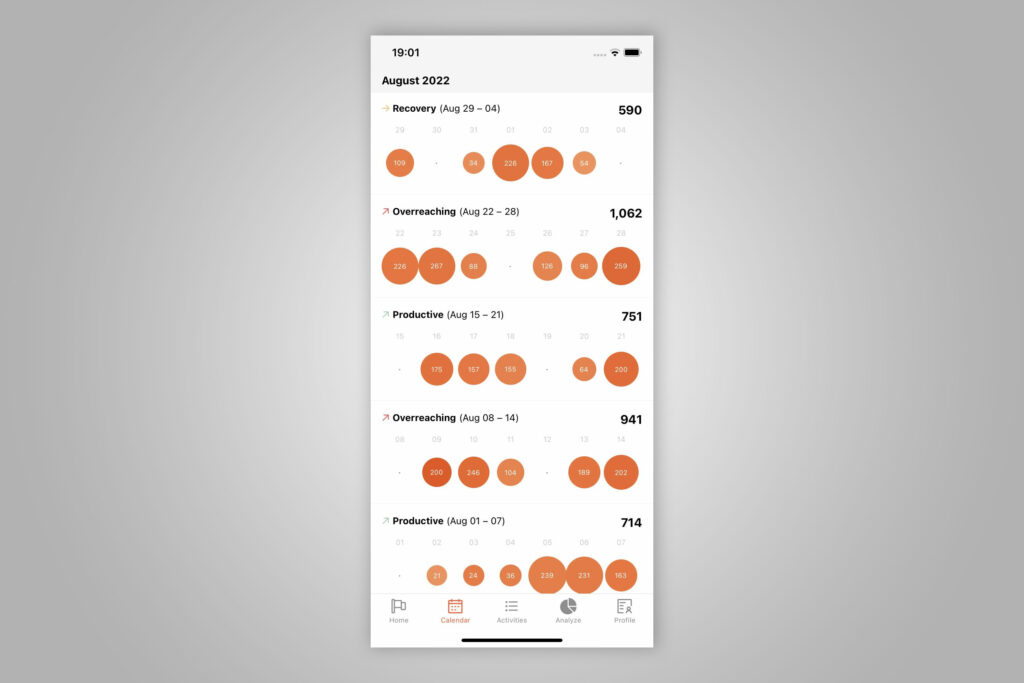
Calendar
The calendar tab is arranged into Monday-Sunday weeks and can be viewed using your Training Stress Score (TSS), duration, distance or elevation. If you are serious with your training, then TSS is how you will usually view the weeks to see how heavy you’re going. Each activity can be accessed through your calendar, which takes you to an overview of the ride.
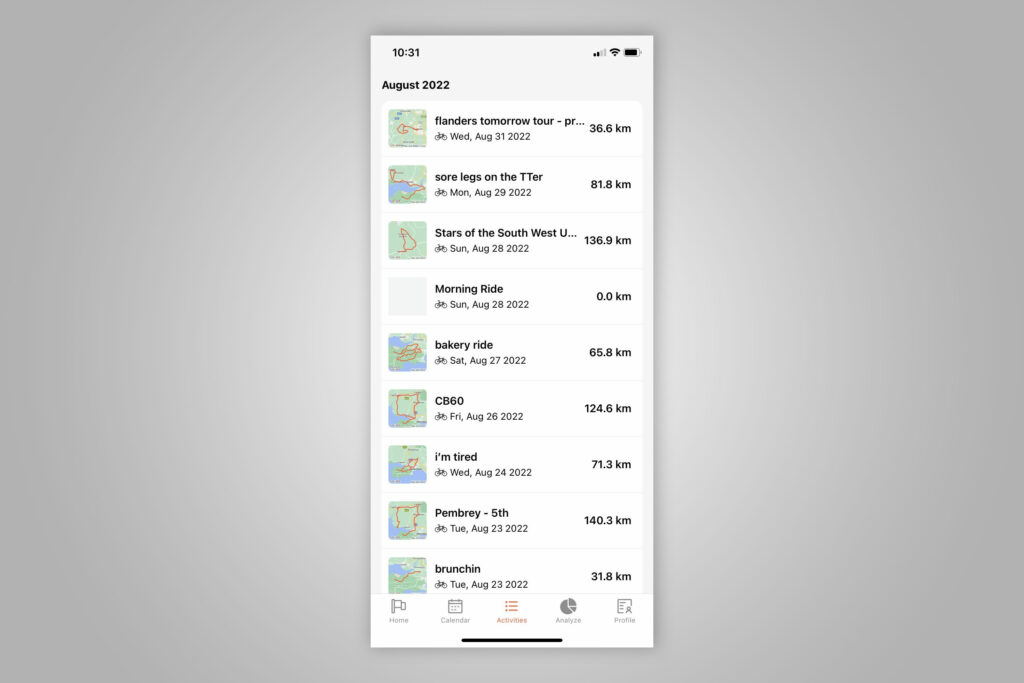
In the Activities tab, rides are listed in date order alongside a mini overview, a small image of the map, the title you gave the ride on Strava, its date and the distance logged.
> Best cycling apps for iPhone and Android
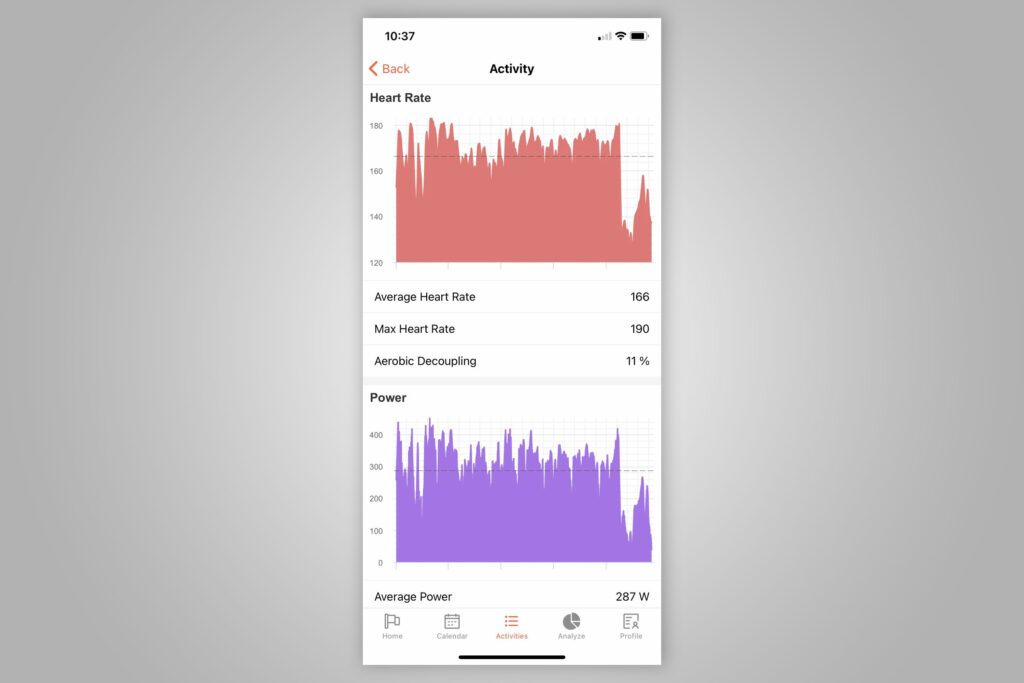
Selecting an activity (I have chosen a National U23 Series round) then gets you a larger view of the map and some basic stats, including distance, moving time, speed, elevation, TSS and normalised power. Keep scrolling and you find graphs for speed, heart rate, and power, and although these provide some useful data points, there is no way of highlighting an areas for a more in-depth view – at least, not on the phone app.
To highlight, say, the last 5km of a race, you’re going to have to use your computer… and even then it will only zoom in and give you data for whatever moment you hover over. It won’t supply average stats for the highlighted section. Personally, that’s the whole reason I want to highlight data in the first place.
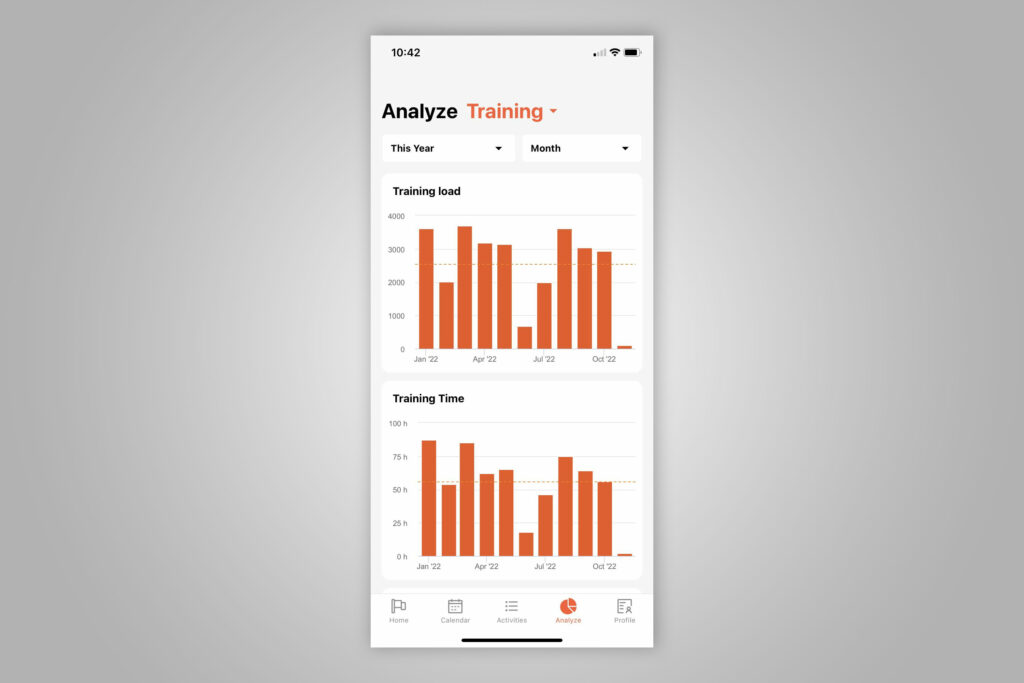
The Analyse tab is split into months with totals for training load, duration, and total work in kilojoules. This can be changed to weeks in the drop-down menu, but then it’s just like your calendar tab, only with a slightly different look.
Value
At $25 a year – currently around £22 – this is a pretty good deal to get you started with training analysis, so long as you’re happy to do it on a computer rather than your phone. Certainly it’s a lot cheaper than TrainingPeaks Premium, which is $119 a year (around £103).
However, if you’re already familiar and want to look into very little aspect of your training/racing, then it’s not really going to cut it and the value will look poor. If you’re unsure, you can try it for a month for $3.
Meanwhile, the Strava phone app has the exact same features as FormBeat and the Premium option is £48 a year, but it boasts extra capabilities on the computer too: route building, ‘Partner Perks’ and even free training plans, for instance.
dPAC.fit is also a bit more expensive at £49.99 per year, but again has the very convenient ‘Virtual Coach’ which offers tips and advice on your recent training. It also shows you key baseline metrics such as dFTP (an up-to-date estimated FTP), dMAP (an up-to-date estimated maximal aerobic power), and an estimated VO2 max.
Basically, the value is great for beginner or casual users, but far less good for the really committed. There is no way to link your own coach to the app either, for instance, so they can’t go analysing your training or setting you goals using FormBeat software.
Overall
FormBeat earns its usefully low price if you’re happy using it on a computer, rather than on a phone, and if you’re not looking for super in-depth analysis. However, the mobile app lacks any form of analysis, and you can get everything else done through Strava’s mobile app – something you will be using to upload and title your ride anyway.
If you are a serious cyclist, FormBeat probably won’t cut it for you, but otherwise it’s very usable, well-priced and beginner-friendly.
Verdict
Good entry-level training analysis, but too limited on phones and not massively deep on computers
All the deals displayed on our review pages are pulled from a constantly updating database feed of the best affiliate deals available. The criteria for deciding on what are the best deals is who is offering the lowest, delivered price. In most cases we will be showing the very best deal available online, but sometimes you may be able to find an item cheaper. If you can please feel free to post a link in the comments box below. To find out more about affiliate links on road.cc click here.
road.cc test report
Make and model: FormBeat Analytics Tool
Size tested: n/a
Tell us what the product is for and who it’s aimed at. What do the manufacturers say about it? How does that compare to your own feelings about it?
FormBeat says: “Intuitive, training-focused cycling analytics that help you improve your performance.”
Tell us some more about the technical aspects of the product?
Training Tools – Useful tools to calculate foundational
power meter training metrics:
FTP calculator
TSS calculator
Variability Index Calculator
Intensity Factor Calculator
Power to Weight Calculator
Cycling Power Zones Calculator
Heart Rate Zones Calculator
How good is my FTP?
Has everything you need for gauging progress, but smartphone analysis is quite awkward if you’re away from your desktop.
At $25 a year, it is hard to ignore. It’s cheaper than any other analysis software bar Intervals.icu, but that’s tremendously confusing to use.
Tell us how the product performed overall when used for its designed purpose
The app provides a simple overview of each workout, but limited analysis. Meanwhile the desktop version allows for better analysis and close-ups on workouts.
Tell us what you particularly liked about the product
The HR/Power/Speed graphs are really easy to visualise, especially compared to the single lines from TrainingPeaks.
Tell us what you particularly disliked about the product
You can’t filter achievements by duration and search for specific PBs, but instead just get the software throwing random achievements at you.
How does the price compare to that of similar products in the market, including ones recently tested on road.cc?
This is CHEAP – like seriously cheap. You don’t get this level of analysis with TrainingPeaks Basic.
Did you enjoy using the product? Yes
Would you consider buying the product? No
Would you recommend the product to a friend? No
Use this box to explain your overall score
This has elements figured out that are really useful, such as graphs that make everything easy to visualise, but the lack of analysis on the mobile app is really annoying – especially when away from home racing and without a laptop.
About the tester
Age: 21 Height: 185cm Weight: 69kg
I usually ride: Dolan Rebus My best bike is:
I’ve been riding for: 5-10 years I ride: Every day I would class myself as: Semi pro
I regularly do the following types of riding: road racing, time trialling, commuting, club rides, Always love some off-road with some mates.


1 thought on “FormBeat analytics tool”
Intervals.icu is worth a look
Intervals.icu is worth a look for descent analytics IMO. You can even import from strava. Perhaps a review of this would be worth road.cc’S while.
Comments are closed.