

- News
- Reviews
- Bikes
- Components
- Bar tape & grips
- Bottom brackets
- Brake & gear cables
- Brake & STI levers
- Brake pads & spares
- Brakes
- Cassettes & freewheels
- Chains
- Chainsets & chainrings
- Derailleurs - front
- Derailleurs - rear
- Forks
- Gear levers & shifters
- Groupsets
- Handlebars & extensions
- Headsets
- Hubs
- Inner tubes
- Pedals
- Quick releases & skewers
- Saddles
- Seatposts
- Stems
- Wheels
- Tyres
- Tubeless valves
- Accessories
- Accessories - misc
- Computer mounts
- Bags
- Bar ends
- Bike bags & cases
- Bottle cages
- Bottles
- Cameras
- Car racks
- Child seats
- Computers
- Glasses
- GPS units
- Helmets
- Lights - front
- Lights - rear
- Lights - sets
- Locks
- Mirrors
- Mudguards
- Racks
- Pumps & CO2 inflators
- Puncture kits
- Reflectives
- Smart watches
- Stands and racks
- Trailers
- Clothing
- Health, fitness and nutrition
- Tools and workshop
- Miscellaneous
- Buyers Guides
- Features
- Forum
- Recommends
- Podcast
news
 audit report front cover
National Audit Office says roads are getting safer… but not for cyclists
New figures out today show that while cycling has become much safer over the past 15 years, danger levels experienced a sharp 11 per cent increase in the three years to 2007.
The report shows different trends for different groups with the overall levels of deaths and serious injuries on the roads falling by 11 per cent from 2004 to 2007, but rising by 11 per cent for cyclists over the same time period, despite the amount of cycling staying broadly constant.
The National Audit Office report for the Department of Transport, called Improving Road Safety for Pedestrians and Cyclists in Great Britain shows, nevertheless, that the 2007 figures for deaths and serious injuries among cyclists had declined by 31 per cent on the average figures for the years 1994-1998. Isn't it wonderful what you can do with statistics.
Despite an overall fall in the number of road deaths, the UK is behind other advanced industrial nations in terms of the number of cyclists and pedestrians who are injured and killed on the roads.
In 2007 alone 646 pedestrians and 136 cyclists were killed and 30,000 pedestrians and 16,000 cyclists injured.
London is said to be the most dangerous place for cyclists. The capital claimed the lives of 6.1 cyclists per 100,000 compared to the national average of 4.3 per 100,000, in 2007.
Other findings include;
- Over the last 30 years the average distance people walk each year has fallen by 19 per cent, while the distance people cycle annually has declined by 24 per cent.
- In the last ten years the amount of walking has remained constant at around 200 miles per person per year and cycling has declined from 43 to 39 miles per person per year.
- Nearly a quarter of all trips are one mile or less, and over 40 per cent are within two miles and so potentially suitable distances for cycling or walking.
- Deaths and serious injuries among cyclists rose by 11 per cent from 2004 to 2007, despite the amount of cycling staying broadly constant.
- The number of deaths recorded by the Department on Great Britain’s roads is falling. In 2007, 2,946 people died compared with the average of 3,578 in the five years to 1998, a decline of 18 per cent, while road traffic increased by 16 per cent.
- Serious injuries and deaths have fallen by 41 per cent for pedestrians and 31 per cent for cyclists over the last decade; the figures for deaths alone have fallen for pedestrians by 36 per cent and for cyclists by 27 per cent.
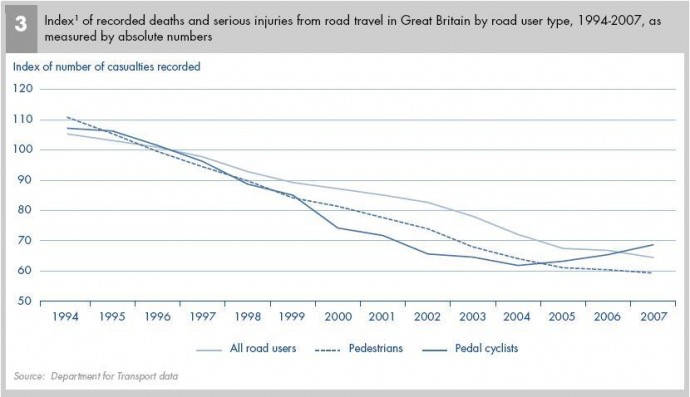
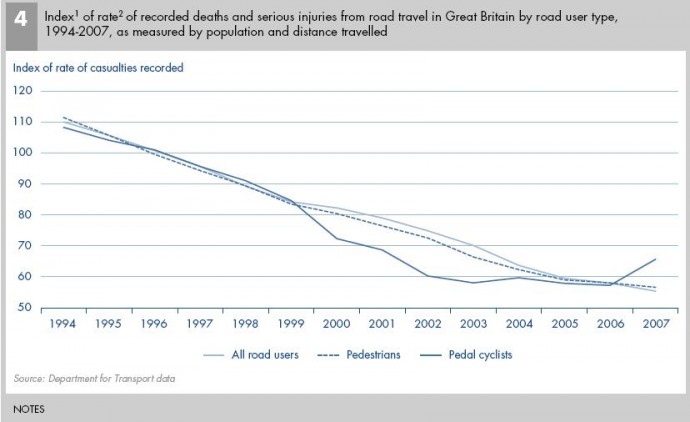
NB: One hundred on the chart is equal to the average for the five calendar years 1994 to 1998, which the Department uses to measure its progress against.
Yesterday the CTC launched its Safety in Numbers research, showing that the places in the country with the most cycling activity have the lowest numbers of cycling casualties.
Their research shows York, Cambridgeshire and Hull are the places with the highest cycle use and are also the safest places in the country to cycle.
Meanwhile in London, which the National Audit Office figures show is the most dangerous place for cyclists, the CTC says bike use has increased 91 per cent since 2000 with a corresponding 33 per cent reduction in the number of cyclist casualties over the same period. All this is firm evidence, says the CTC, that the more cyclists there are, the safer cycling becomes.
Follow the link to the CTC's Safety in Numbers pamphlet
Read the full National Audit Office report
Latest Comments
- chrisonabike 2 sec ago
Since we're talking (checks thread again) why UK cycle sales have plummeted to 1970s levels, and now "infra" and "US" ... surely one of the best...
- AidanR 21 min 22 sec ago
I thought that too, but apparently you can get safety compliant bull bars. I'm sure they're safe relative to the ones that became popular in the...
- David9694 28 min 16 sec ago
Driver hospitalised after flipping car onto roof in Swindon street...
- chrisonabike 45 min 11 sec ago
Granted, given the width they didn't manage to quite block all the cycling access, but they tried...(from here - skip to the other side to see the ...
- HarrogateSpa 1 hour 19 min ago
I agree, TV coverage of three stages as a one-time-only does nothing for the sport of cycling.
- dh700 1 hour 46 min ago
One of, and maybe the only, redeeming value of the post-my-life culture, is that some of the adherents will do the cops' job for them -- which is...
- quiff 2 hours 29 min ago
You can both be right - the scheme was introduced by Labour, but the fines levied under it increased dramatically in 2023 under the Tories.
- slc 4 hours 27 min ago
Agreed, there was no supension. There were various modifications of the plan, and a long time before the Beafort Rd and Crews Hole Rd one way plan...
- Geoff H 6 hours 26 min ago
My only use for a camera is for "evidence". I only check it (& check before and after every ride) to make sure it is working. While I have had...
- Velo-drone 8 hours 23 min ago
I don't see anything in what they said to suggest that they even think about 3rd party reporting of dangerous driving as being part of the picture...
Add new comment
2 comments
I take your point, but the cycling press does have a duty to report on cycling stories that hit the national press, as this one did today.
The Guardian has an interesting follow-up - http://www.guardian.co.uk/commentisfree/2009/may/08/cycling - which includes a quote from Chris Peck of the CTC, criticising the NAO's statistical analysis methods:
"The decision to look at serious injuries since 2004 is entirely unhelpful. They've cherry-picked data to support their point – as statisticians they should be aware that you shouldn't measure changes against a single year.
Using the proper measures for cycle use and injuries shows that since 1994-98 – the baseline the government measure injuries against – cycling has increased by 7% (2005-07) but deaths have fallen by 23%, while KSIs have fallen by 34%."
As you'll see, our story is a little more balanced than most, going in on the fact that while there was this 11% recent increase in danger (albeit calculated using questionable mathematics) cycling in general has become much safer over the past decade and a half.
Fear not!
Apparently one of the big factors that put people off cycling is their fear of getting knocked off and that roads aren't a safe place for a bicycle. If this is the general view point of why people aren't taking to bicycles why is it that road death and accidents seems to be the only news that the cycling press report on? Is there some sort of conspiracy going on or does fear make us better cyclists?