



The number of cyclists seriously injured in collisions on the UK’s roads rose by 14 per cent in 2025, though cycling fatalities have continued to fall, the Department for Transport’s latest road casualty statistics have shown.
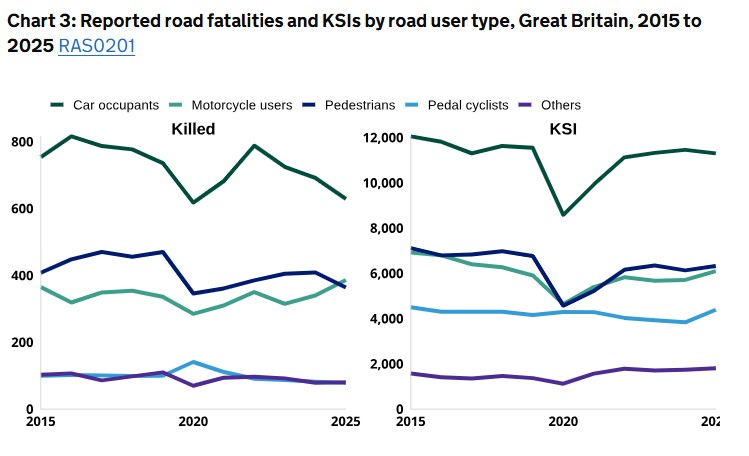
16,042 cyclists were reported as casualties in road collisions in Great Britain in 2025, making up 13 per cent of all reported road casualties last year. 4,390 people riding bikes were killed or seriously injured in 2025 (15 per cent of all KSIs), while 79 cyclists were killed, comprising five per cent of all deaths on British roads.
The 2025 figures mark the fifth year in a row that cyclist deaths have fallen in Great Britain, dropping from 82 in 2024 and 87 in 2023, and the fifth time, since records began in 1979, that the annual death toll has fallen below 100. Cycling fatalities have also dropped by 21 per cent since 2015.
The number of cyclists killed or seriously injured, however, saw a sharp increase of 14 per cent compared to 2024 (though still two per cent lower than 2015’s figures).
As the Department for Transport notes, non-fatal casualties for cyclists are amongst the most likely to be under-reported in road casualty data since cyclists have no obligation to inform the police of collisions.
According to the DfT’s ‘Reported road casualties Great Britain 2025’, which outlines and analyses the casualty statistics for all road users, 1,538 people were killed on British roads last year, with car occupants accounting for 629 of those deaths.
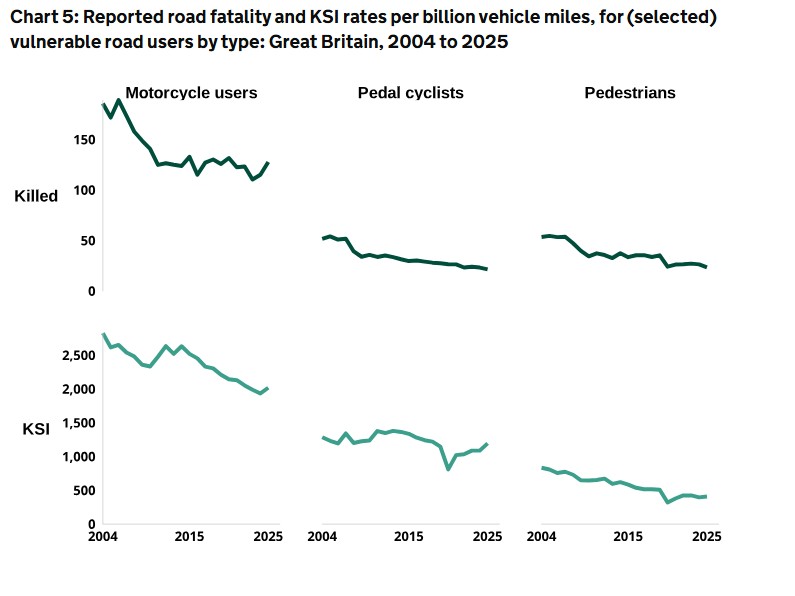
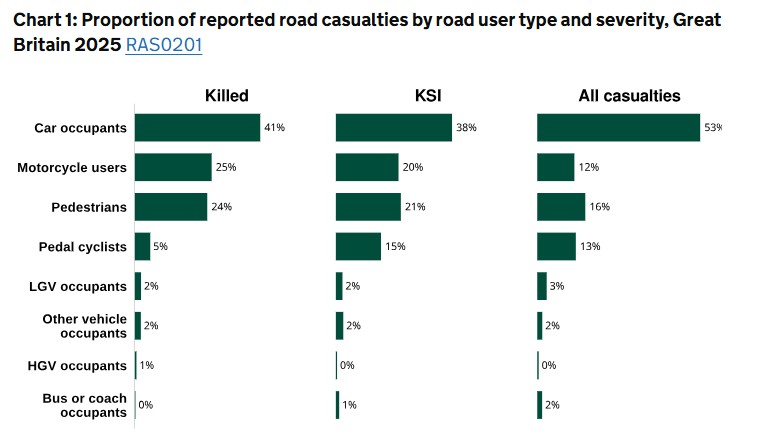
Car occupants accounted for the largest share of any road users when it came to casualties, with 41 per cent of fatalities, 38 per cent of KSIs and 53 per cent of overall casualties. Meanwhile, vulnerable road users – cyclists, pedestrians, and motorcyclists – accounted for over half of all fatalities and KSIs, with motorbike riders alone comprising a quarter of all fatalities.
364 pedestrians were also killed in 2025, a drop of 11 per cent compared to 2024, while 19,978 were reported as casualties.
When it comes to what vehicles are involved in road collisions, cars accounted for 60 per cent of vehicles in fatal collisions, and 69 per cent of vehicles in collisions of all severities.
Analysing the likelihood of a vehicle to be involved in a serious or fatal collision, the report found that HGVs were involved in seven per cent of all fatal collisions, compared with two per cent of overall collisions.
In contrast, pedal cycles accounted for four per cent of all vehicles involved in fatal collisions (which also include cyclist deaths), compared with nine per cent of all collisions.
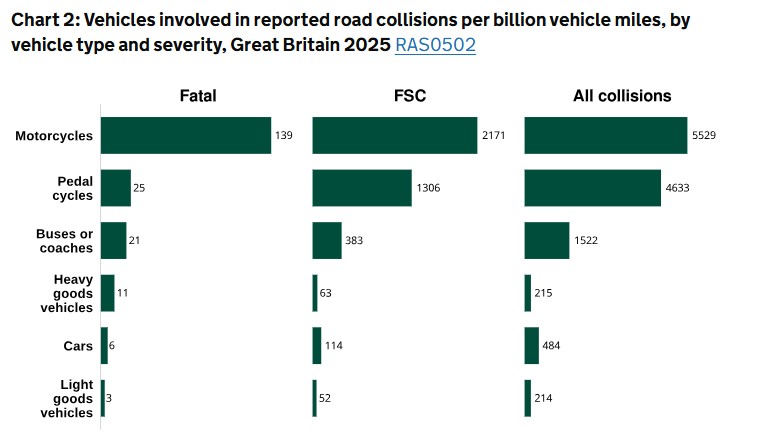
Proportionally, cyclists have the second highest rate of collisions per billion miles travelled, with 4.633 bike-related crashes, and 25 fatalities, for every billion miles (a long way off, however, the 5,529 crashes, and 139 fatalities, per billion miles involving motorcyclists).
92 per cent of all people killed in crashes involving a bike were the cyclists themselves (in contrast, 54 per cent of people killed in collisions involving a car were its driver or passengers).
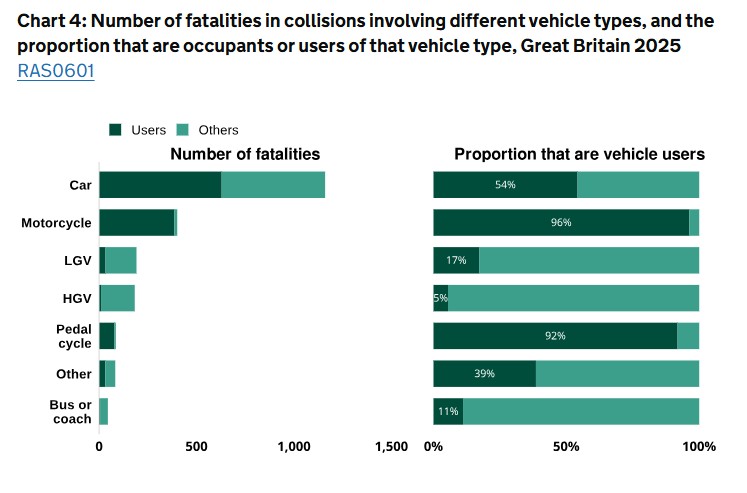
45 of the 79 cyclists killed last year were in crashes involving a car driver. 10 involved the driver of a light goods vehicle, four a HGV driver, one involved a bus or coach driver, one involved a pedestrian, and two involved another cyclist. 12 cyclists were killed in single-vehicle crashes.
Meanwhile, most pedestrians killed or injured in reported road collisions were hit by motorists in 2025. 245 pedestrians killed were involved in incidents with drivers (67 per cent of all pedestrian fatalities), and overall there were 15,222 pedestrian casualties involving motorists (76 per cent of all pedestrian casualties).
By comparison, cyclists were involved in just two incidents which resulted in a pedestrian fatality in 2025 (one per cent of all pedestrian fatalities), while 718 pedestrians were injured by cyclists (four per cent of all pedestrian casualties).
When it comes to age, cyclists in their 30s and 40s were most likely to be involved in collisions in 2025, with 1,428 crashes. 1,171 bike-related casualties were people in their 50s and 60s, while 529 involved children up to the age of 16.
At least a quarter of collisions were estimated to involve someone driving or riding to or from, or for, work.
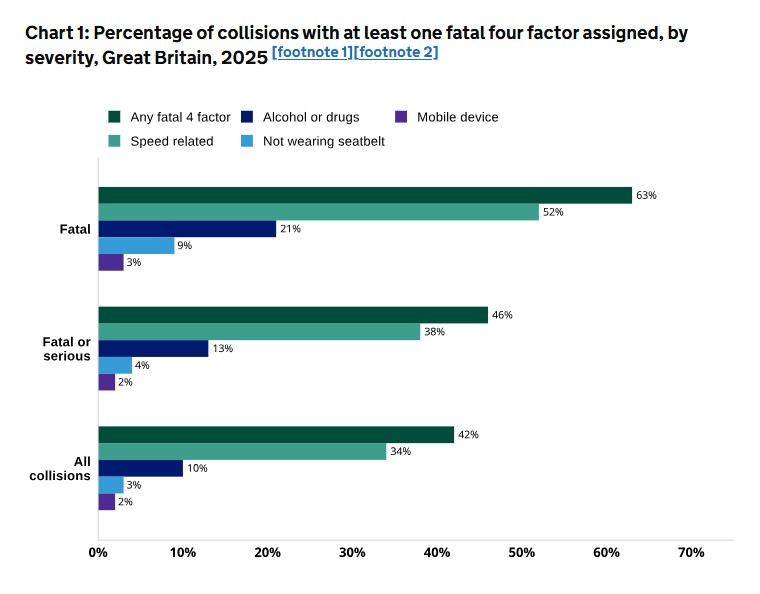
13 per cent of all fatal collisions had an “affected by alcohol” road safety factor assigned by police, while and 12 per cent had an “affected by drugs” factor assigned. 32 fatal crashes in 2025 – three per cent of the total – were attributed to people being distracted by their mobile phones.
In a statement responding to the DfT’s findings, IAM RoadSmart’s policy director Nicholas Lyes said they showed a “lost decade in terms of reducing the number of serious casualties and highlights the urgency of implementing measures to improve road safety”.
“An overall increase in the number of killed and seriously injured in 2025 is troubling and we are deeply concerned by the increase in motorcyclist fatalities,” Lyes said.
“Those using two wheels are among the most vulnerable road users and we need a concerted effort to bring these numbers down by reforming licensing and training. The UK Government’s strategy will undoubtedly address some of these issues, but it must be backed by clear timelines, proper funding, and decisive action if we are to meet the ambitious targets the strategy sets out.”








12 thoughts on “Serious crashes involving cyclists up by 14% but number of cycling fatalities falls once again on UK roads, new government figures reveal”
Many thanks for posting these statistics and showing the downward trend in fatalities. One thing that stood out for me when clicking through to the government statistics page is the UK’s exemplary record on this Vs other European countries, especially the much-vaunted record of The Netherlands, which actually shows twice as many fatalities as the UK per million of the population.
The question that arises is therefore: why are the greens and other left-wing parties so keen to adopt an inferior and more dangerous road system when ours is obviously working well? It smacks of a need to regulate people’s lives and curtail freedom.
We need to stop these idiotic Dutch roundabouts and segregated cycling infrastructure, and get people sharing the road in a fair and equal manner, when the statistics show it’s safer to do so. (Chart shows road fatalities per million population)
Ho ho ho! No, we need to stop these idiotic cyclists completely (or limit them to velodromes, parks and maybe “rail trails”) – that way there won’t be any cyclist road fatalities!
Simples!
Meanwhile in many parts ofEurope they’re finding the benefits of making it such that lots of people don’t use cars for every journey – by fixing it so it’s convenient and increasingly safe – despite much larger numbers of people getting around outside of cars than in the UK…
The fatality rate in the UK has fallen five years in a row during a period, starting with the Covid years, in which building of “idiotic Dutch roundabouts and segregated cycling infrastructure” has massively increased, so in fact using your own benchmark the statistics clearly show the benefits of increased cycling infrastructure. Not quite the gotcha you seem to think when viewed through non-troll lenses, Nige. The stupidity of your “argument” is further clearly illustrated by the fact that the list-topping Norway, Sweden and Denmark all have massive segregated cycling networks.
The Dutch model used to demonstrate clearly the safer nature of the Dutch system, e.g. in 2018 the Netherlands had 8 fatalities per billion kms ridden compared to 21 in the UK; the primary reason for the increased fatality rates in the Netherlands has been attributed by experts to the massive uptake in ebikes (47% of new bikes sold in NL are now ebikes compared to 10% in the UK), particularly amongst the older population, nothing to do with the infrastructure.
Yup.
The UK has latterly tried add the safety back in after it was lost for vulnerable road users. (And after giving all the direct routes / valuable space over to motoring). But it’s offering a modicum more safety in return for them losing a lot more convenience – so that has been reducing the “problem” also!
Plus we lean heavily on “but people can be trusted to be reasonable” and “for any misbehaviour police it better”. Unfortunately those are not good assumptions or choices for safety in a motornormative environment. (And road policing isn’t a priority anyway).
NL isn’t the only place in Europe they’ve realised that mass motoring the old way is unsustainable (for lots of reasons). They’re just the furthest on.
In NL they still have some challenges because the (larger – thanks US!) car strikes back, and there are some questions about the impact of e-things. But they’re *still* investing in improvements, and proportionally significantly more than the UK, even though they’re already far ahead…
“attributed by experts”, yeah sure, ok! Citing 8 year out of date per capita figures shows the weakness of your argument.
Here’s a couple of reasons I believe that the Netherlands fatality rate might be higher than the UK (independent of the crappy Dutch infrastructure), none of which you and Chrisonatrike suggested or mentioned:
1) not enough people wearing helmets in Netherlands. All sane people know that wearing a cycling helmet can potentially save lives, yet the Dutch seem to think themselves too special to wear one. Despite the fact the Netherlands has a superior privatised health system compared to our rotten, inefficient NHS, post-crash options are limited for people with severe head trauma which will inevitable lead to increased fatalities in the Netherlands.
2) Risk compensation by drivers and cyclists. Cyclists are lulled into a false sense of security thinking that segregated cycle lanes are their special infrastructure which insulate them from accidents. They don’t. Then, car drivers take more risks due to increased congestion caused by the same cycling infrastructure, leading to a double-whammy of risky behaviour.
3) Cultural issues. People in the UK are renowned for their stiff upper lip, stoic, courteous behaviour. They naturally protect more vulnerable road users. I, myself, had a magnificent cycling experience earlier today on the local country lanes, waving and saying hello to the locals and cyclists alike. There really isn’t a place like the UK (well, outside London anyway) that matches our hospitality and camaraderie.
P.s. I’m not sure who Nigel is, I assumed you meant Nigel Farage but I can assure you I’m not him and that he has more pressing things to do than write responses on a cycling website.
I hope that’s helped your understanding a little, and enabled you to think a little independently rather than just suck in information that self-described “experts” want you to believe. Oh and Norway et Al are terrible comparators as hardly anyone lives there (and who’d want to to be honest? Lol!)
@jackcycles Thanks Nige.
@jackcycles
1) Aaah yes, the plastic hat defence.
“All sane people” know that helmets *may* reduce the severity of a small fraction of injury modes below an already low threshold of impact energy, for which vehicle collisions are typically devastatingly above said threshold. Lets just ignore the peer reviewed correlation and causation between helmet use mandates, reduced cyclist numbers, and increased hostility towards vulnerable road users.
2) If segregated infrastructure isn’t segregating vehicles from pedestrians and cyclists, what the hell are people doing driving cars into the space explicitly designed to exclude them? That’s not a fault of cyclists, pedestrians or the infrastructure, that’s down to fuckwits being allowed control of a motor vehicle.
Where segregated infra reintegrates with general purpose roads, those can be locations for conflict, but that depends on a) the quality of the infra design and b) the competency of people using the infra. The competency demographic of the general populace is assumed to be identical across all modes of transport, therefore risk is directly proportional to potential harm. Hence the introduction of Rule H1 (the concept of presumed liability) into the Highway code in 2022.
In the worst case scenario, a fuckwit on a bicycle is only likely to kill themselves, maaaaybe one pedestrian. Fuckwits in cars regularly kill themselves, passengers, and multiple others outside of their vehicle.
3) [S]Cultural Issues[/S] Nationalist Exceptionalism
[I] Rule Brittania, Brittania rules the waves…[/I] etc. The rest of the world doesn’t do things like us, those bloody foreigners don’t understand how good we are, how good we’ve got it, except for the NHS, but we’re doing so well in spite of it. When I went on holiday to the continent they were so rude to me they pretended not to understand what I was saying, so I had to shout loudly at them. etc, etc.
Regarding the name “Nige” I’ll give you the benefit of doubt and presume you’re not the same person under a new pseudonym, and enlighten you to the fact that there was a troll on this site who went by that moniker, possibly out of adoration for the one you mentioned, and they left a somewhat lasting mark on that particular archetype of (lack of) personality. As such “Nige” has been dubbed the title for that pattern of behaviour on this site in much the same way entitled and arrogant women of middle-age are referred to as “Karens” across the internet
A pedant writes – The concept introduced to the Highway Code is the ‘hierarchy of responsibility’, not ‘presumed liability’.
@mdavidford Mea culpa.
Potato / starchy tuber of the Solanum genus, Tomato / edible fruit of a different species in the Solanum genus.
Presumably, given the username, you’re more familiar with the former?
@perce we all like a polite and courteous poster! Much as motorists like a polite and courteous cyclist doffing their helmet (possibly from a hedge they’ve obliging leapt into along, say, a leafy lane in Essex).
Wonder if the impact of a relatively large change (the Wales reduction of default 30mph speed limits to 20mph just over 2 years back) can be detected here? That would be expected to move some of those deaths into the serious injury category…
(Probably hard to do as – without so much controversy – individual speed reductions have crept in local spots all over the UK).