

An analysis of how amenable cities are for cyclists has warned that the UK continues to struggle to match its European neighbours and is lagging behind on safe cycling. Likewise, just as the UK’s best cities for cycling haven’t closed the gap with the best on the continent, the analysis also suggests that UK cities outside of London remain well behind the capital too.
PeopleForBikes’ annual City Ratings measure the quality of a city’s bike network, with each city receiving a score out of 100 each summer based on data analysis of factors such as safe speeds, protected bike lanes, reallocated space, intersection treatments and network connections.
A low score (0-20) indicates a weak bike network, meaning the city lacks safe bikeways or there are gaps in the network, while a high score (80-100) indicates that most common destinations are accessible by safe, comfortable bike routes that serve people of all ages and abilities. There are links to the full methodology, historic data and details about the software here but, in short, it is a means of ranking cities on an annual basis, to inform policy decisions and see changes to a city’s offering to cyclists over time.
PeopleForBikes states its latest annualised data, published today, “shows that the gap between London and the rest of the United Kingdom persists, whilst the nation as a whole has shown no improvement from last year in relation to its performance compared to European countries.”
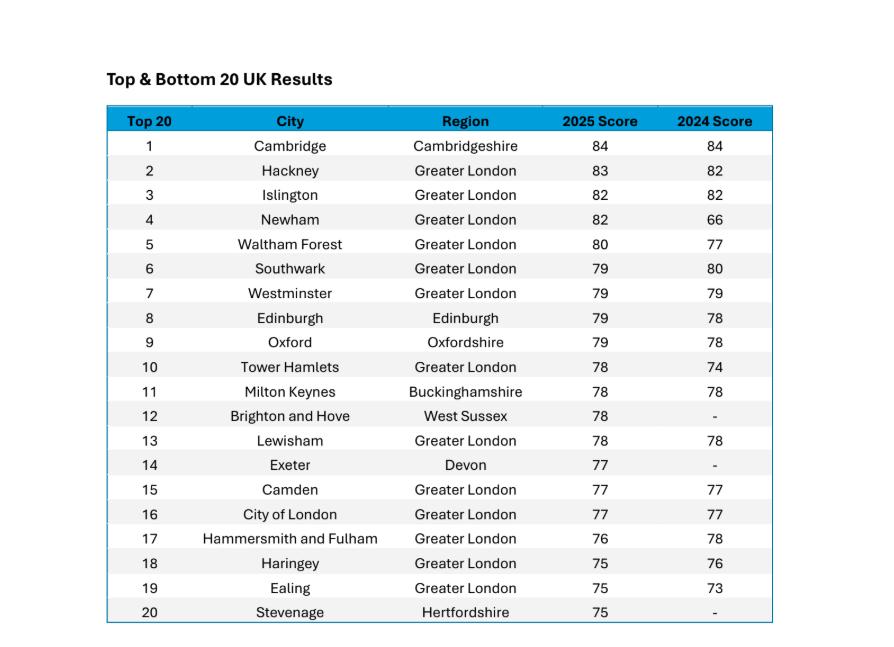
Of the top-rated European locations, just two are in the UK (Cambridge in 16th place with a rating of 84, and Hackney in 17th with 83). In comparison, the Netherlands has six of the top 20, Paris and Lyon are rated 89 and 86 respectively, and Brussels (87), Leuven (85) and Munich (85) all outrank the best of the UK locations.
While the minutiae of exactly what score cities are ranked may not be worth spending too much time on, PeopleForBikes does note that Hackney was 13th last year, while both Islington and Southwark have dropped out of the top 20 in the past 12 months, suggesting that other European cities have made gains, while “London leads the way [in the UK], but remains stagnant”.
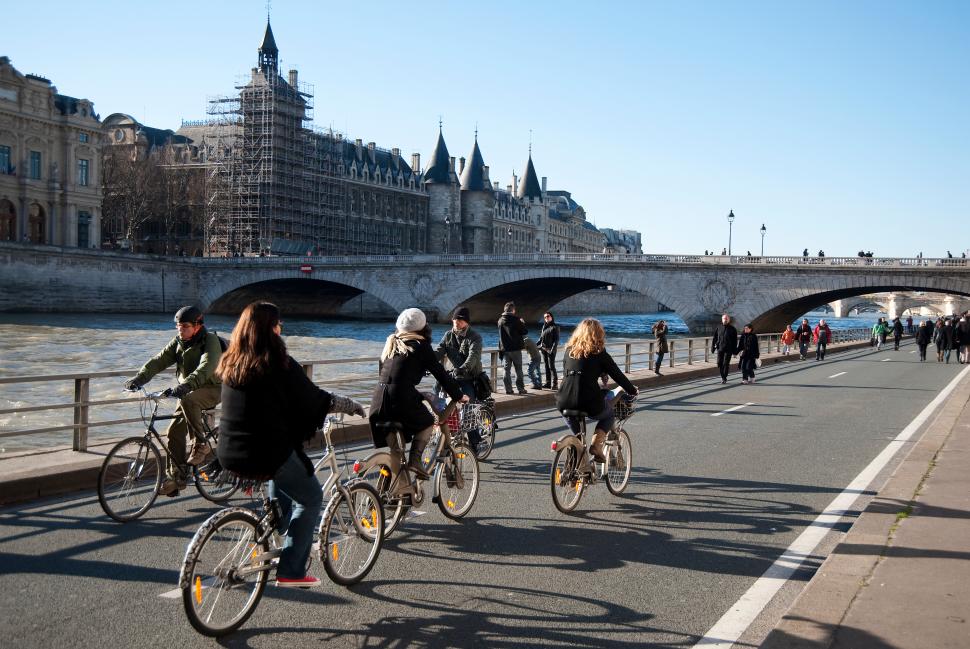
For example, Paris has “continued to see the benefits of the significant transport policies introduced by Mayor Anne Hidalgo”, taking joint first place alongside the Dutch cities of The Hague and Delft. By comparison, PeopleForBikes suggests there “has been limited signs of progress” on cycling in the first year of Labour government, even if “they have moved away from the transport ‘culture war’ which the previous government had leaned into”.
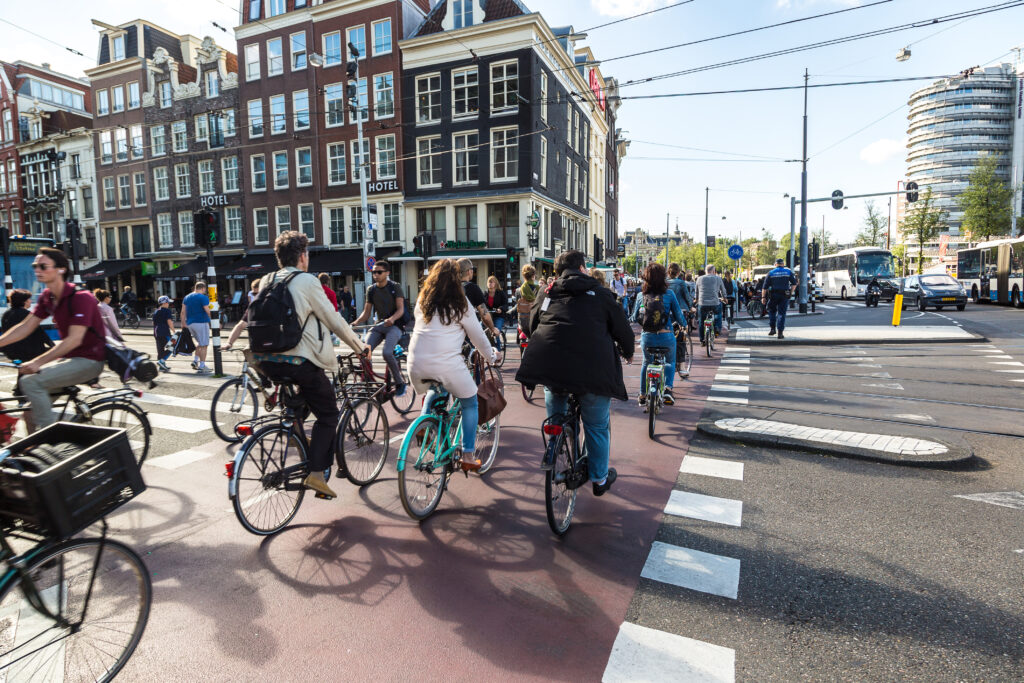
Cambridge may have earned the highest ranking of any UK location, but 14 of the top 20 are in London, suggesting there is something of a gulf between the capital and the rest of the UK when it comes to cycling accessibility.
The lowest-ranked UK locations were Leigh-on-Sea (32), Bury (40), and Solihull (41). The gulf is perhaps most noticeable when looking at the regional averages, London’s rating up from 69 to 70 this year, while the next best region was Hertfordshire with an average rating of 56.
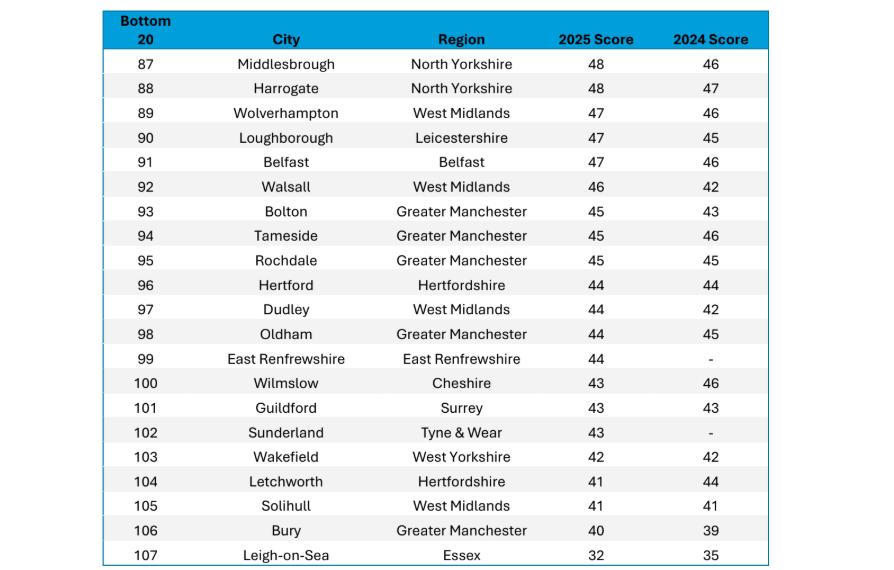
The region with the third highest average rating was North Yorkshire with an average of 53, followed by Greater Manchester and the West Midlands, both on 50. The average for all locations outside of London is up slightly from 54 to 57 last year, which shows the gap has closed slightly, but PeopleForBikes called the change “negligible”.
PeopleForBikes said it had contacted a wide range of local authority politicians and MPs to share the findings and offer further data and information, however the delay in the introduction of the third Cycling and Walking Investment Strategy (which a deadline for passed in March) was “most concerning”.
Jenn Dice, PeopleForBikes’ president and CEO commented: “This year’s City Ratings highlight the progress being made in parts of the UK and the ongoing need for greater investment in safe, connected cycling lanes nationwide. We know that when cities invest in better infrastructure, more people choose to ride, and that leads to wide-ranging benefits like reduced congestion and better health outcomes.
“These findings give decision-makers and advocates the evidence they need to take bold, informed action to make bicycling a more accessible and appealing option for everyone.”


16 thoughts on ““Limited signs of progress”: UK continues to lag behind European cities on cycling infrastructure, report reveals”
Why does Paris get a score
Why does Paris get a score for the whole city, while London is divided by borough?
That’s a good point. I live
That’s a good point. I live in both Paris and London, so my thought is; Paris has a contiguous cycle network. I can set off from my home near the 14th and cycle for miles and miles on cycle paths in any direction. In London the quality and connection is very disjointed. If you venture into the suburbs of London you can forget it – apart from some noble efforts in Enfield and Walthamstow. Even in the centre it’s haphazard and as soon as you cross a borough, infrastructure can disappear.
I don’t know but London is a
I don’t know but London is a much bigger / more populous place. Plus the boroughs have a lot of autonomy (such that eg. RBKC had simply blocked cycle routesthat would have run through it). Is that the case in Paris?
No, the City of Paris under
No, the City of Paris under the mayor controls all the public roads in Paris, whereas in London the mayor only has control over TfL roads which constitute only about 5% of the total, the rest of the roads are controlled by the boroughs. This is why Paris has such a homogenous cycling network now whereas London still lags behind with many brilliant cycling routes ruined by significant gaps where boroughs (Westminster and Kensington & Chelsea are the worst) have refused permission for sections to be constructed.
A site which ranks
A site which ranks international places, distilling some complex and region-specific things down via metrics in some data analysis software to a single number you say?
Well, I’m sure that will deliver sensible results…
Paris ranks above Utrecht – indeed, any Dutch city?
Cambridge is better than Groningen? (I believe Cambridge is very pleasant to cycle around, but…)
Islington (indeed – Edinburgh) is better than Zwolle?
Hmm…
(Their metrics sound reasonable, but I think I might stick with my subjective “looking at lots of videos of the place and Streetview safaris – or even just visiting – for a while yet).
The other issue is (again –
The issue is (again – haven’t read *all* their working…) they appear to be US-based and (understandably) will look at “what to measure” from within that perspective. So – for example – we see scores for intersections:
“Points for intersections with traffic lights, minus points for more vehicle lanes” may well be a good metric for developing, highly motor-centric places (which tend to need more intersections with lights, because motor vehicles… and be reactive e.g. put in infra in response to “blackspots”). It might give a lower score in places which have gone further and started to think in terms of separate networks for different modes.
The basic problems are that 1
The basic problems are that 1.) their methodology is flawed in that it overweights access to places (without caring cyclists get runover on the way there); 2.) it uses posted speed limits rather than 85th percentile at which motorists are driving (there’s a big, big difference here in Anchorage where I live); 3.) it’s heat map is out of touch with reality in nearly all of the cities in which I’ve ridden; and 4.) it gets some of its baseline data wrong. For instance, it puts Boise, Idaho residential street speeds at 30 mph (they’re actually 20 mph) and assumes people drive the residential street speeds that are posted. The posted speed in Anchorage is 25 mph, but people never drive that slow. OK, they might get down to 25 when they slam on the brakes before a speed bump, but they’re stomping the accelerator as they go over the bump. Then, too, there is a reference to measuring with standards that “align with NACTO street and bikeway design standards.” That’s all and good, but PeopleForBikes apparently missed the point that Anchorage political leaders have pointedly refused to accept NATCO standards in the belief they would restrain motor vehicles. Having been in Boise and London, I can fairly say Anchorage makes Boise look great and compared to Anchorage, London is heaven. And yet in this scoring system, it comes in only slightly better than Anchorage. Obviously, they didn’t factor in city noise. London cyclists don’t know how well they have it. It’s amazing what a difference it makes to be in a city with traffic moving on the streets at 20 to 30 mph than at 45 to 55 mph, which is the scary norm in much of Anchorage.
A US organisation ranking
A US organisation ranking cycle safe cities in Europe is like Saudi Arabia ranking women’s rights in other countries.
Middlesbrough is ranked 87th
Middlesbrough is ranked 87th but I imagine they will tumble even further towards the bottom once they rip out the Linthorpe Road cycle lane later this year. That cycle lane helps form, somewhat of a disjointed, connection to retail and to the bus/train stations.
Weirdly they’ve put Brighton
Weirdly they’ve put Brighton and Hove in West Sussex.
are the stats on their
are the stats on their website the latest ? or still a previous years ? as they dont match up with the top 20/bottom 20 shown above.
Regardless overall it seems a reasonable judgement even if the methodology seems a bit complicated and not entirely sure how it works
But Its not like people outside of London havent been saying for years, their cycling infra doesnt remotely match up to the stuff in London or Cambridge.
Think it’s only really a good
Think it’s only really a good comparison of places within the US. Between there and countries that are at quite different places in terms of “providing better for things other than motoring” (or even within those places) probably not so much.
And like any measure – “what for”? Some website says data shows a US place I’ve never been is 1% ahead of some UK place I probably won’t go to. Now what?
For sensible “relative to” measures probably the best current “metric” is simply “what proportion of journeys are cycled / driven / walked?” For a bit more understanding “who by / how far / some measure of casualities on the roads” (e.g. as people seem to trip up on here – having no casualties because nobody is cycling, or they’re only cycling round a park – not much to celebrate).
Beyond that you’re better off with a local guide or two, discussing transport policy / trends / particular “features” of history / politics / the law. And/or going to see, virtually or in person.
Incomplete as well, no
Incomplete as well, no Copenhagen which I’ve just visited and looks fantastic for cyclists. There’s Reddit threads with local cyclists complaining about tourist cyclists not hand signalling and obeying other rules of the road. And the pedestrians don’t cross on red lights!
“Continues to lag behind”!!??
“Continues to lag behind”!!?? More like “is still in bed with a hangover and an extra duvet having missed the flight while the rest are crossing the finish line”.
I’m watching the current
I’m watching the current Michael Portillo train travelogues – so far he’s been through Croatia, Norway and Denmark and he’s now in Switzerland. OK, it’s picture postcard through a lens, but always there’s something nagging away at me, saying “this is how people in a civilised country behave, this is what an affluent country looks like.”
Certainly should be – the
Certainly should be – the Swiss did a good job many years ago of transforming from what might have been a poor place (but for the cheese and Toblerone mines) into tech (watches, weapons) and service industries (banking).
Not the best in Europe for everything but certainly looks pretty good eg. here: https://m.youtube.com/watch?v=pWnreLG_cvc
… and the trains are wild: https://m.youtube.com/watch?v=muPcHs-E4qc