

We were pointed in the direction of a question on this A-level physics exam paper from Edexcel today. The question is about how much extra carbon dioxide is emitted as a result of cars ‘queuing’ behind a cyclist on a narrow rural road.
Carlton Reid, who plans on featuring the question in his upcoming book Bike Boom says it was brought to his attention by his daughter. He says it is a prime example of the ‘insidious’ trope that cyclists cause air pollution.
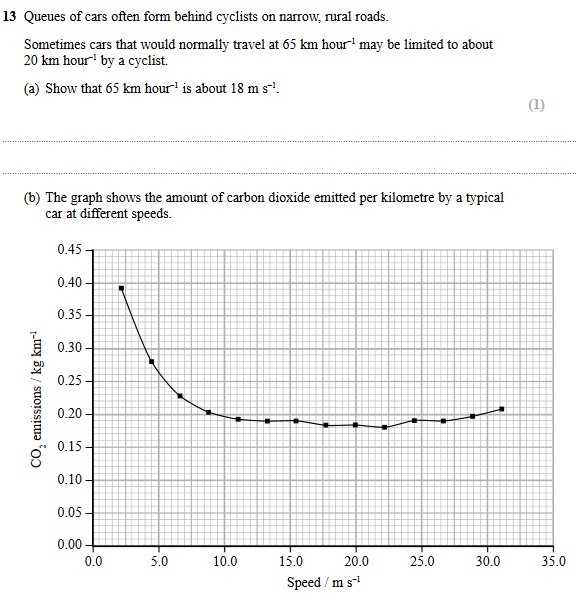
Here’s the question in full.
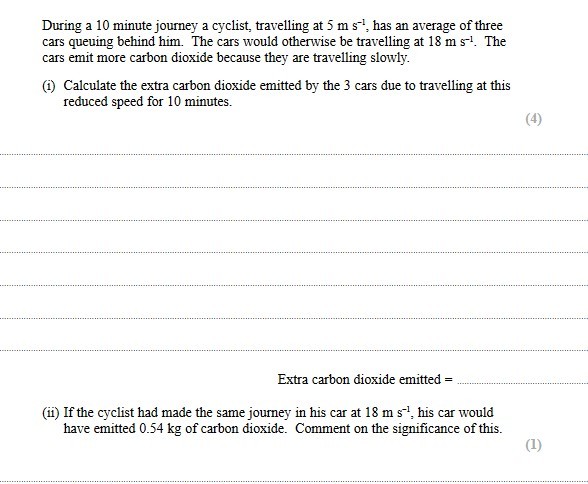
It strikes us that it would be ten long minutes for the cyclist with three cars queued up behind.
We did wonder whether the final answer punchline was that carbon dioxide emissions would be higher once the cyclist had become a motorist. However, according to the answers (and somewhat miraculously, also according to our own calculations before we found those answers), this is not the case.
A possible follow-up question could perhaps have been: ‘How many of these motorists need to get on their bikes before carbon dioxide emissions are reduced?
We’d also quite like to see a similar question for an urban location where average driving speeds are significantly lower even without one of those pesky cyclists causing pollution by holding everyone up.


57 thoughts on “‘How much extra carbon dioxide was emitted because of the cyclist?’ asks A-Level exam paper”
Propaganda, pure and simple.
Propaganda, pure and simple.
What if there were 3 cyclists
What if there were 3 cyclists on the road that would mean 3 less cars = zero emmissions, in turn cancelling out the immisions of the 3 cars queing behind them?
But YES, propaganda I agree
c. The CO2 emmissions quoted
c. The CO2 emmissions quoted are for the fuel consumed by each vehicle. Factor in the CO2 generated by the car production and end of life recycling processes, also the CO2 associated with the recovery of crude oil, refining into road fuels and delivery to the petrol station forecourt.
Mungecrundle wrote:
You got their first while I was trying to do the calculations!
Was the cyclist wearing a
Was the cyclist wearing a helmet?
Or, cars release the same
Or, cars release the same amount of CO2 during their manufacture as they do, on average, for a lifetime of use. In the situation described above, what additional CO2 is released over a cyclist whos bikes manufacture cost 0.02kg per km on average?
Judging by part ii) Edexcel
Judging by part ii) Edexcel are a bit sexist too
Just typical of the nasty
Just typical of the nasty insidious anti-cycling propaganda and clearly designed to detract from the overwhelming benefits of cycling.
18kph! – is this road through
18kph! – is this road through a ploughed field?
beezus fufoon wrote:
It’s 18 m s-1 not 18kph so 65kph although if you’re as hacked off as I am at what seems to pass for an a level physics question these days then it’s an easy oversight to make.
muhasib wrote:
18kph! – is this road through a ploughed field?
— muhasib It’s 18 m s-1 not 18kph so 65kph although if you’re as hacked off as I am at what seems to pass for an a level physics question these days then it’s an easy oversight to make.— beezus fufoon
5 metres per second is 18kph
As the roads are narrow and
As the roads are narrow and rural, the top speed the cars may travel at may well reach 65KpH, however as the nature of these roads are invariably narrow and twisty, how often would the cars reach this speed and what is the effect of acceraltions and deceleration when aproaching other hazzards on the road such as bends, unsighted crests of hills and approaching traffic? Edexcel please show your workings.
Is the Carbon Dioxide figure
Is the Carbon Dioxide figure the actual figure or the lies that are put out by the manufacturers and never challenged by Governments?
RedfishUK wrote:
If one or more of the cars is a VW group TDi model, calculate the actual emmisions using the correction factor of 734%. . . . This is why if it’s a VW/Audi diesel behind, that is where the cyclist prefers them . . . <Cough cough splutter>
And of course this makes no
And of course this makes no mention of the fact that CO2 isn’t even close to being the worst thing that comes out of a cars exhaust pipe.
Added to which, were they Volkswagen cars? If so, you can multiply that CO2 figure by a few……
you also need to calculate
you also need to calculate the total life-cycle cost, not just of manufacture, but of disposal too. You also need to factor in the cost of road construction, as cyclists can use the same standard of road, but don’t need to. You could easily use these calculations to justify better provision of segregated routes.
But I am interested, as they’ve actually put some effort into quantifying the question. I thought this video was a one-off: https://www.youtube.com/watch?v=eS5fQqnB24U , as it suggests there is an environmental impact of queueing behind cars, but makes no effort to do the boring actual sums
At least with this you have a starting point and some of the core variables to consider. Obviously there are other questions – you regularly see huge queues of cars, without a cyclist in sight, so if you switched from bike to car you would be increasing the probability and impact of those jams.
You also need to consider the total impact of these incidents against the reduced impact of switching from cars to bikes – yes, there may be the odd occasion where other road users increase their CO2 pollution, but what’s the overall situation
I love these sort of questions …
The question also doesn’t
The question also doesn’t address the Co2 that goes into the rebuilding of roads that’s required due to vehicle loadings… I am thinking of repeated decelerations and accelerations of 100’s of kgs
Um, the curve on the graph is
Um, the curve on the graph is entirely wrong. It’s well known that driving faster uses more fuel, not less!
ChrisB200SX wrote:
Yes and no. Had the graph continued above 40mph, the curve heads up again.
Up to about 25mph, the increased efficiency from using higher gears means that emissions decrease with speed. Over 40mph, the effects of wind resistance become greater such that emissions will increase.
I do not see exam questions about the CO2 savings from a queue of traffic being stuck behind a JCB Fastrac at 40mph though.
Well the graph goes up to 31
Well the graph goes up to 31 m/s which in my book is 111.6 km/hr which is pretty much exactly 70 mph. I.e this is meant to represet the entire legal range of speeds.
Now if you look at http://www.afdc.energy.gov/data/10312 you will see some govenment data on how fuel consumption dips with speed particularly over 50 mph which for most cars is around the optimal fuel economy. Typically fuel usage at 70 mph increases by a factor of around 1.5 compared to the cars’ optimal speed.
Now I *assume* that CO2 production must be excatly linear with fuel consumption unless the vehicle has some clever device for washing CO2 (not cataytic converters – they turn poisonous gasses into things less poisonous including converting CO into yet more CO2!)
So I believe this graph is a fabrication – possibly VW??
But actually thats EXACTLY the point. The question assumes that drivers on a lane will drive with the same ecomomy that VW cars drive in a testbed. Which they never do!
Hugh Davis wrote:
Not so. Using your own reference, for the petrol car (which the OP refers to), at 70mph the car is only 25% less effeiceint rather than your exaggerated 50%. The car is also significantly more efficient at 70mph than 45mph where your graph cuts off.
If you want to pursue conspiracy theories then I would point you at the 55mph target. I have had 2 2 litre turbo diesel cars from the same manufacturer, same model the second of the two having supposedly a more efficient engine and greater efficiency. In order to achieve higher efficiency at 55mph however it has higher gearing, which in my real life 50% rural 50% urvban driving results in 8mpg average less.
As for the graph being a fabrication? The same graph is the same “medium sized car” data used by organisations on opposite sides of the 20mph speed limit debate, and Ricardo actually present the data as a scatter plot by model. Surely if it were a fabrication, one of these organisations would have come up with something better. The data is however very different for sub 1.4l cars which are inefficient at highet speeds.
The biggest fallacy in the data presented in the OP is the lack of acceleration and braking, which screws up any constant speed data.
That said, its a bloody school exam question, not a government white paper!
ChrisB200SX wrote:
It’s actually correct. There is a sweet spot minimum on most petrol cars between 40-80 km/h. It’s a bit higher when you’re going slower, and gets much higher when you go faster.
Is this what science
Is this what science education has come to now?
In an effort to make it ‘socially relevant’ they end up just revealing their ignorance of politics and sociology?
Do they make any attempt to justify their assumption that the speed of cars is entirely independent of the distribution of transport modes? Or that the car driver’s decision to drive that route, use that vehicle, or to undertake the journey at all, is independent of their expected journey time? Everything else is held constant? How realistic an assumption is that?
I’m glad we had proper O levels in my day, as I’d have lost marks by just writing ‘oh, just piss off, you’re fooling no-one ‘ as my answer.
And there I was thinking that
And there I was thinking that physics was a science of observation and fact.
I also understand that observation and fact has shown that ‘Vorsprung durch Technic’ really means ‘Technology will overcome the test’.
I rode down the huge traffic jam this morning – two miles of stationary traffic in two lanes, with just enough room between them for little me. Curiously, I was the only bicycle and the only vehicle making any worthwhile progress.
Erm yes the amount would be
Erm yes the amount would be affected as the cyclist is breathing out carbon dioxide but otherwise the emissions from the cars don’t actually matter as cars give out way to much no mater how fast they travel unless there electric power that is
Ricardo did a more thorough
Ricardo did a more thorough exercise in evaluating any increased emissions on introduction of 20mph speed limits. Their conclusion:
• 1. There is no direct relationship between fuel economy and posted speed limits – the impact of 20 mph speed limits depends on changing driver behaviour
• 2. Steady-speed results and “emissions factor” curves must be used with care
• 3. IF the reason to introduce 20 mph limits is to: • encourage more walking and cycling • encourage slower, smoother, more considerate driving THEN it seems likely that this should result in a reduction in carbon emissions and quite possibly NOx and PM
And the DoT concurred:
“In principle, driving more slowly (at a steady pace) will always save fuel and carbon dioxide emissions unless a quite unnecessarily low gear is being used. The underlying arguments are that moving a vehicle at a lower speed requires less power, and that avoiding unnecessary acceleration and braking saves energy.” Department for Transport
Wow. That was appalling.
Wow. That was appalling.
So these cars are normally
So these cars are normally driving along at 40 mph (65kph) with no manoeuvring, braking, etc to affect the fuel consumption, so presumably a long straight road. How did they end up travelling behind a cyclist for ten minutes (about 2 miles, at 12mph/20kph) anyway? Surely there would have been an opportunity to overtake (although, again, that would affect the fuel consumption figures).
The graph is presumably for a
The graph is presumably for a single car.
Is there a CO2 reduction from the queing cars drafting? or only if they tail gated?
Three of the very most
Three of the very most considerate drivers in the whole universe found the patience to drive behind a cyclist going at 5m/s for a full 10 minutes….I’ve heard it all now….what is this Fantasy Driving League?
I’m just made up that I
I’m just made up that I managed to work it out and get the right answer!
Agree that chosing ‘cyclist’
Agree that chosing ‘cyclist’ was unfortunate example when calculating Co2 emissions! (could substitute for ‘Tractor’ maybe?) because of the wider impact of choice of transport is not considered here. However nor is the social or political context – but you realise that’s probably out of scope when setting physics questions, surely?!
700c wrote:
everything has a context. Companies and political campaigns use “surveys” as marketing/influencing tools:
https://hbr.org/2002/05/how-surveys-influence-customers
it’s all part of that behavioural economics business, “anchoring” they call it : https://en.wikipedia.org/wiki/Anchoring – getting in first and unconsciously setting the frame by which people process information. Like going first in bartering
so, I don’t think this is a grand plot to brainwash young people, but it does tell you a lot about the person setting the question. Normally, it takes quite some time for commonly held-misconceptions in apparently innocous context such as exam questions to become obvious “Judy has 16 shirts to wash and iron …” , but this one clearly raising eyebrows already. Makes you wonder what sort of things that seem “normal” now will be regarded very differently in a few decades ….
700c wrote:
I think all this ‘background’ stuff can build up and contribute to a sort of narrative that many people don’t often stop to think about – “everybody knows” that bikes are a nuisance to right-thinking drivers, and the transport of choice for losers as well, because that’s how most people often see them represented, in ads, newspaper columns, TV shows etc. Individual instances on their own seem trivial and for only militant cyclsts (or whatever) to get worked up about but I reckon it all counts.
Chuck wrote:
on the other hand, if they do study physics then at least they might have some grasp of kinetic energy and forward momentum, so at least you won’t have to explain to them why you were unable to stop in time after they’ve pulled out on you without looking!
Lots of good responses.
Lots of good responses.
Are drivers really “often” stuck for 10 whole minutes behind a bicycle? Nah, they’re having you on!
Did it have to be a bicycle? Do drivers never get stuck behind anything else, such as a slower car or a tractor (after all, they did specify rural roads)?
Shropshire has lots of rural roads and it’s not often a car is ‘stuck’ behind a bicycle for long, partly because so few cyclists use the roads outside town centres. There may be a handful of riders on a Sunday morning but otherwise us rural commuters are very thin on the ground.
On narrow roads drivers will often squeeze past me anyway but are likely to have to slow or stop when meeting a car coming in the opposite direction before accelerating again. Many seem to brake for blind bends rather than anticipate it and ease off the throttle early.
Simon E wrote:
How very refreshing to see a polite poster. After all the effing banker comments over on the Brexit thread over the last couple of days I really was beginning to wonder!
Simon E wrote:
Did it have to be a bicycle? Do drivers never get stuck behind anything else, such as a slower car or a tractor (after all, they did specify rural roads)?— Simon E
On my 15 mile commute, mostly rural, I’ve never been held up by a cyclist for even one whole minute when driving, nor had a motorist stuck behind me for that long when cycling.
Tractor, yes, especially with large trailers. Combine harvester, yes. Sugar beet harvester, yes. On the other hand, it’s fairly obvious that those vehicles have a useful job to do; far too many motorists assume that all cyclists are just out for the fun of it, rather than cycling because it’s practical.
(Even when cyclists are out on a sporting event, or training, the complaints from motorists tend to be ridiculously exaggerated.)
To be producing more CO2, you
To be producing more CO2, you need to have an average of 2.36 cars behind you at all times*. In other words, for every kilometer you spend on your own, you need to spend another holding up 4-5 cars.
The emissions are per km travelled. For any given distance, a train of 4 cars going 18ms emits less than a train of 3 going 5ms. ** However, it’s also the case that a single car going 5ms emits less than 2 cars going 18ms. ***
* solving .27n > .19(n+1)
** that is 3*.27 = .81 > .76 = 4*.19
*** that is .27 < .38 = 2*.19
Am I just a nerd,or is the
Am I just a nerd,or is the most distressing aspect of this not the fact of this NOT the propaganda, but the fact that the basic physics of the (A level PHYSICS) question is wrong!
As every cyclist knows from personal experience, most of the effort on a flat road is related to aerodynamic drag. And, as every cyclist knows, this drag increases not linearly with speed, but by the square of speed (approximately). Therefore, the graph, which is horizontal, would actually be sloping upwards, with higher carbon emissions per mile at higher speeds (Hands up if your car gets the same MPG at 70 MPH as 40MPH…and is not a Volkswagen)
Are we sure this not from the ‘alternative physics’ paper? God help us all.
Front Row Cyclist wrote:
Yes and no. You are talking about delivered power to the wheels, ignoring the effects of engine efficiency and gearing. As others have pointed out, this is an extract from a graph of real measured data used by everybody from the DoT to the AA, and yes, it slopes up rapidly beyond 40mph. The shape of the graph is the result of the engine hitting its sweet spot, the use of higher gears at 40mph than 20mph, and drag at high speeds, so its not as simple as just saying higher speed equals less efficiency.
See here for the full data.
http://ee.ricardo.com/cms/assets/Documents-for-Insight-pages/Transport/06.-20mph-and-carbon-emissions-Duncan-Kay.pdf
The rate determining step for
The rate determining step for most car journey undertaken is how many other motor vehicles are on the same route at the same time, not the number of cyclists.
Time spent waiting behind a cyclist will typically mean less time waiting behind other cars at the next junction, since the prescence of the cyclist can have the effect of spacing out a flow of traffic.
Additionally the restrictions caused by waiting to overtake cyclists are typically dependent on the amount of car traffic on the road in the other direction rather than the number of cyclists.
You could probably come up with a good maths problem to illustrate/model this.
This isn’t new at all. I had
This isn’t new at all. I had this as one of my exam questions 3/4 years ago. I remember I got it wrong because I forgot to multiply by the three #idiot
I agree this is a pretty stupid question and it does nothing for promoting tolerating behaviour etc. It’s odd, exam boards usually go to ridiculous lengths to make themselves seem diverse and multicultural, yet they come up with questions like this.
To be honest, I didn’t read that deep into it. It’s not exactly an unlikely scenario, but I do recall what I would have like to have told the person who wrote the question 😛
They also put an incorrect question in my A Level physics paper. Thanks Edexcel…
The question should have read
The question should have read:
“During a 10 minute journey a cyclist, travelling at 5m/s has an average of three cars overtakng him. The cars are travellng at 18m/s. None of the car manage to reduce their speed, take into account oncoming traffic or deviate from their intended path. The cyclist is left slightly fearfull of his life, considers giving up cycling and knows that any sort of reaction wll be met with the standard diatribe of not paying road tax, not having insurance and jumping red lights”
This would not have affected the CO2 emissions and should be moved to a sociology exam
The question does say
The question does say “average” i.e. it implies that there is a regular change of cars held behind during the journey. Which taken to it’s logical limit, we could infer that the rural road is actually experiencing much higher motor vehicular traffic than it was ever designed before, this most likely due to it been a rat run that has become popular because of the 1000’s of cars crawling at an average of 20kph on the dual carriage way running parallel.
So from a political point of view, the real question should be why are so many cars making that journey each day? It all comes down, in my opinion to the nonsense of choice. We are conned into believing we have this amazing choice of where we are educated, where we work, where we shop and where we live. But we don’t really. We end up living where we can afford to rent or buy. We work where we can find work that pays enough to meet the bills. And we shop where it is most convenient.
Think about it carefully before refuting my analysis. The last time you moved, was it to somewhere you wanted to because of the location for locations sake, or because of family or work? The last time you got a new job, did you choose that job out of a selection of job offers, or was it the only one that came close to meeting your greatest needs at the time?
We’re frequently under the illusion of choice when there is little, except perhaps the devils choice. Therefore wouldn’t it make better sense in the long run for more joined up thinking. Jobs where there is housing, and housing where there are jobs. I live in Lincoln and through no choice, I often find myself working in Newark or Nottingham. So each day I pass others from Newark or Nottingham who are travelling to work in Lincoln. Sure, there are jobs such as brain surgeon or nuclear physicist that fewer people are able to do, but many jobs are really and truly capable of been performed by a greater number of people.
For instance, as of 2015 there was an estimated 865,000 people in the UK qualified as teachers. So how insane is it that individual teachers add maybe 10 hours a week to their working life simply commuting? Which leads to the other major source of congestion. The school run. Few people could have failed to noticed that traffic runs a little better during school holidays. It certainly does where I live. We seem determined to raise a generation of lazy unfit and frightened people who only know to move around their environment by car. Car drivers of the future who will have no personal understanding of what it means to cycle or even walk further that the driveway.
But I doubt things will change because we all suffer from this selfish protectionist attitude, look after your own interests and sod everyone else. Hardly the definition of civilisation in my opinion.
BTW, was this actually an A level standard question???? I assumed it was something like O level. But then sat in our google driverless cars we hardly need much mathematics
It’s all ‘Bollix’
It’s all ‘Bollix’
Another thing missed out is
Another thing missed out is the cost of the co2 in transporting all the oil from the well to the pump.e.g. extracting it, transporting to the refinery by oil pipeline , or tanker. Refining it. Then sticking it in a lorry and distributing it all around the world’s petrol stations. That cost is massive.
iii) If all three cars would
iii) If all three cars would have done a very close pass instead of staying behind the cyclist, how many miles would they have to drive in the UK before being pulled over by an undercover policeman on a bike?
Disgraceful.
Disgraceful.
Just found this thread.. it
Just found this thread.. it appears this question has captured our imaginations, some wonderful responses on here.
Regardless of the ‘anchoring’ aspect, leading one to think of prejudice, I wonder if the ‘question setter’ felt a little surprised or enlightened after finding out the answer? (We will never know!)
Luckily I cycle at 7.5m/s not
Luckily I cycle at 7.5m/s not 5m/s, in which case the savings from me not driving are greater than the savings for the 3 cars being slowed. (don’t think I have ever had 3 cars behind me at once, never mind on average.
also I note they don’t quote emissions at 60mph, only 40mph, as it would undermine their propagana, not many roads i know where the cars stick to 40 (close to maximum efficiency)
Are you all missing one
Are you all missing one important point here? This question is testing the ability of the candidate to make a number of related calculations and needs a good understanding of the SI system of units and having made the necessary conversions, make a comparison.
It may appear easy to some of you, it is above the complexity of mathematics required at GCSE even with the new more demanding syllabi. Me, science degree and currently teaching GCSE Physics and KS3 Maths, sciences (all) and geography!
A good student shoud get full marks and this would be needed to progress to higher levels such as A grade.
ianrparsons wrote:
Huh?
I do think it seems a bit ‘dumbed down’ , but I might be wildly misremembering my own A level physics days (obviously academic standards peaked in the exact year I did my own A levels, all generations before and after that moment possess inferior qualifications).
But that isn’t the point. The point is that it’s framed to leave a seriously skewed impression – and that’s unlikely to be accidental.
I mean ‘framed’ in the sense of the very, very dubious assumptions made about traffic speeds (a world of perfect free-flowing traffic, only spoiled by those pesky cyclists?) and driver behaviour (always waiting patiently behind for mile-after-mile?), and in the limited range of alternative scenarios allowed to be considered – i.e. just two, ‘cyclist there’ vs ‘cyclist not there’ – ‘motorist not there’ or ‘separate infrastructure’ apparently not being conceivable.
It could be a case-study in how “science” can appear neutral yet be hugely biased, and as such might work well in a classroom discussion context.
But I don’t think it belongs in an exam, where no discussion is allowed.
I’d say it was actually prejudicial because it is going to act as a form of trolling for some students, which is an unfair distraction from what one is being examined on. You shouldn’t put provocative political propaganda in the middle of a science-exam.
FluffyKittenofTindalos wrote:
Lol! Yes it’s a poor question, but written 4 years ago so it’s not going to be ‘trolling’ anyone anymore – apart from conspiracy theorist-cyclists reading far too much into it!!
Probably the same years I did
Probably the same years I did mine, 1970 for O levels and 1972 for A levels. I also suspect that the provocative political nature of the question would completely by pass the candidates seeing it once only in a an exam room. More likely to provoke debate when used as a past paper in following years though. That is until they cahnge the syllabus again.
Motorist hold up ,
Motorist hold up , slow down and delay each other in towns and citys – and get in the way of cyclists , causing us considerable delays.
Is this really an A level
Is this really an A level question? If I answer a few questions like this then I’ll get an A and go to university?
Obviously the correct answer to the question is that the cyclist is responsible for no emissions at all. The curve is for ideal conditions, so if it is to be valid, the road is straight and level. Therefore the first driver in the queue could easily overtake safely and so is responsible for holding up the cars behind….
The first driver is clearly not competent to be driving so should have their licence taken away….
Of course if the cars were electrically powered they would not be producing any emissions (not really true but this is only an exam question) and would be more efficient at low speeds….